Choosing constructs
From 2006.igem.org
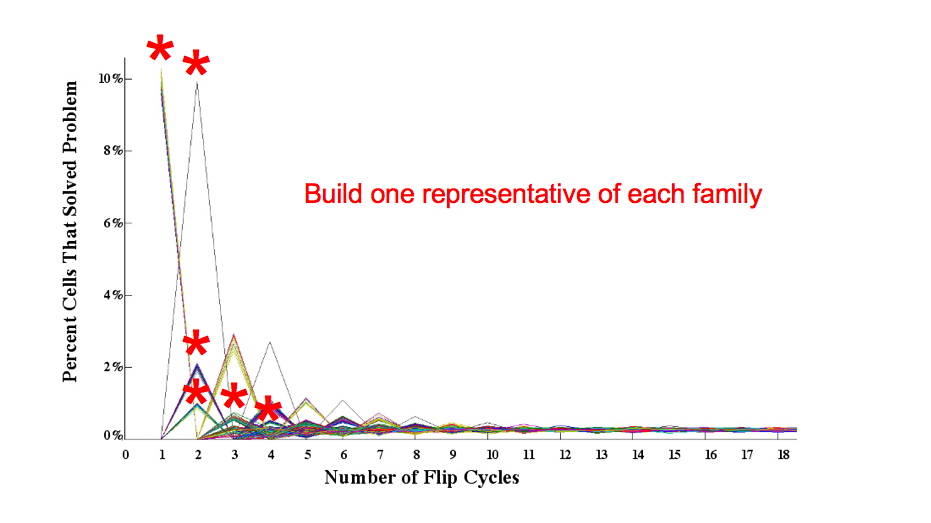
Each line in the graph represents one of the 384 initial configurations of 4 pancakes. We simulated 20 random flips for each initial configuration. The percentage of plasmids that are sorted in the correct order and orientation after each number of flips is graphed. Asterisks indicate groups, or families, of initial configurations that behave the same. These families are determined by the number of different sequences of moves that can be made to sort the stack.
