ETH Zurich 2006
From 2006.igem.org

standing (L-R): Marco, Alexandra, Arthur, Olga, Dimo, Marko, Robert; in front (L-R):
Adding numbers is easy, isn't it? 1234 plus 5678, for example, is 6912. But how do engineers add binary numbers instead of decimal ones? And how, in the end, can this be done by a living cell? We, the members of the ETH Zurich 2006 iGEM team, are currently working on these questions, whereas the last one seems to be not trivial.
What the addition of numbers has to do with pattern recognition, how our model and the mathematical analysis look like, and how the experiments are realized will be explained on these wiki pages. We wish you a pleasant time with our pages. Enjoy it!
Contents
|
Coordination
TODOs
Modeling
- Parts Model the whole System with Sensing, Pops duplexer and Half adder (Marco and Franz) -- probably not
- Model whether a different strength of input is necessary for the AND and XOR Gates (Marco)
- Finish modeling the second AND Gate and find a biological way to implement it and write the DNA and order it (Marco and Robert) -- probably not
- Bring model parameter up to date & update simulation results/senisitivity analysis (Marco)
Lab
Responsible: Robert for the preparatory experiments, Olga for the assembly and testing of the gates.
- Read the literature on the XOR and AND Gates, check carefully for strains needed and compatibility of the parts (Who?)
- Prepare a protocol for parts assembly (Olga)
- Assembly of the light sensing device from the parts we received from UCSF Voigt's lab (Arthur) DONE
- Test the light sensing device (Arthur?)
- Assembly of the chemical sensing device (Franz, Dimo, Robert, Marco, Marko, Olga) DONE
- Test chemical sensing device DONE?
Documentation
Responsible: Alexandra for the registry, Arthur for the Wiki.
- enter lab experience report to registry
- Make a drawing of the DNA to have an overview of which parts will be consecutively on the same DNA piece (Alexandra) (this is part of the #system deployment section --Ajk)
- Revise images & graphics (Marco):
- correct errors
- unify symbols
- extract missing ones from slides, see here
Presentation/Poster and PR
Responsible: Franz for the presentation, Dimo for PR/Poster
- design and write the final presentation (with LaTex beamer class) IN PROCESS
- draw a team logo and find a team name (Franz and Dimo)
- design and order T-Shirts (Dimo)
- setup poster, collect info/distribute tasks
Structure:
1. Introduction of the team and ETH Zurich and of the half-adder idea - about 4 min
2. Engineering Part - about 8 min
3. Biological part - about 8 min
(4.) Questions from the audience - 10min (I think, Marco (modelling) and Marko (biology) should also be ready to answer questions)
Schedule
Available as Google Calendar: iGEM 2006 ETH Zurich
- Thu 20.7., 1700: kickoff meeting in CNB E 121
- 27.7.-3.8. 1st group phase
- Define project in more detail within two groups
Thu 27.7., 1700: meeting of entire group to share ideas
Thu 3.8., 1700: decision on final project - 15.8. 1700
- Tutorial "Modelling of AND gate"
- Until 20.8.
- Finalize DNA design, order it
- September,October
- Implement design (registry bio-bricks, ordered DNA)
- 27.9.
- Fix the flight dates and send the proposed flights to Jörg
- 23.10.
- Latest point to start getting our presentation going and to finish the iGEM wiki documentation
- 30.10.
- Project documentation on the Wiki has to be complete
- 4./5.11.
- Jamboree in Boston
Participants and availability
- Michael Friedmann:
- Dimo Brockhoff:
- Franz Zürcher:
- Olga Nikolayeva:
- Alexandra Choutko:
- Arthur Korn:
- Robert Schütz:
- Marco Terzer:
- Marko Jovanovic:
finding a project
Initial project ideas
The fruits of some brainstorming and research
proposed projects
We split up the whole team into two groups, each proposed a project after these two weeks.
- Meat monitor project (Michael, Dimo, Olga, Arthur, Marko)
- Half adder/pattern recognition project (Franz, Alexandra, Robert, Marco)
It was decided to further pursue the Half adder project idea.
design process
This could be documented as a hierarchy of global specification -> structural specification steps (ie after-the-book engineering process). Even if nobody had that in mind probably we can mold wathever actually happened into this pattern.
system level
system behavorial specification
- Write something with a chemical on a petri plate (like ETH for example)
- Let Bacteria grow uniformly on the plate
- Expose the plate to a picture (black and white) of the same pattern
- Result:
- Bacteria gets green when pattern on the plate and picture match (light and chemical)
- Bacteria does not express fluorescent protein when pattern on the plate and picture match (no light and no chemical)
- Bacteria gets red when pattern on the plate and picture do not match
           light   no light
chemical     A         B
no chemical  B         C
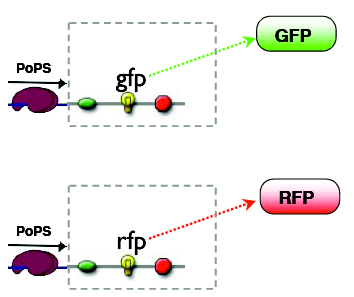
The outputs can be reported by fluorescent proteins, the mapping of states to outputs is arbitary, our choice is:
A: green
B: red
C: no fluorescence
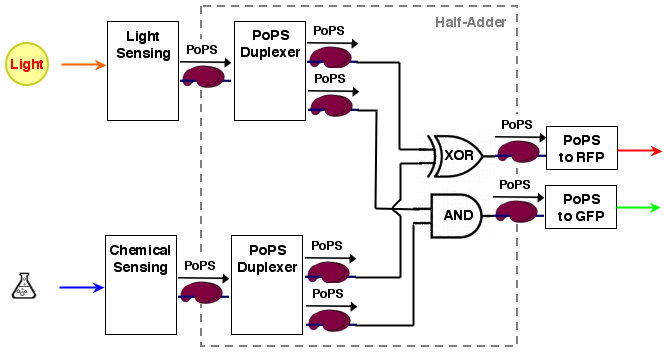
Considering the green and the red output as being separate, the logic mapping the input states to the output states is AND for the GFP and XOR for the RFP. Together they amount to a half adder logic.
The whole system is only considered at it's steady state, dynamic processes are only of minor interest.
system structure
The whole process can be brought into a common input, logic, output form:
[light sensing]----->[       ]-->[reporter A]
                     [ logic ]
[chemical sensing]-->[       ]-->[reporter B]
As it turns out, a half-adder can be used as logic part. A half adder can add 2 binary values and thus has 2 inputs. It has also 2 outputs, the sum value S and a carry out C (If an n-bit adder is conststructed from half adders, the carry out of the lower significant bit has to be carried over to the next position).
A half adder can be constructed from an XOR gate (the sum value S) and an AND gate (the carry out):
   A               A
   ^               ^
  1| 1 0         1 | 0 1
  0| 0 1         0 | 0 0
   +-----> B       +----> B
     0 1             0 1

  S = A XOR B    C = A AND B
For our purposes, sum output S and carry out C are exactly the values we desire for our system. the system architecture looks then like the following:
system modeling
according to the system structure, we first decompose our overall system into devices:
- xor gate
- and gate
- iptg sensing
- light sensing
- pops duplexer
for every device, we define the set of ode's (ordinary differential equations) to model the dynamic behavior. our interest is mainly the resulting steady state i.e. when the system reaches equilibra for the concerned species. this means that production and concumption rates are balanced for encymes, metabolites, mRNA etc.
modular simulation
modular modeling allows simulation at different detail levels, e.g.
- single devices, different variants of same device type, as a basis of decisionmaking
- reusable complexes reoccurring in different devices, like
- transcription
- translation
- encymatic reactions
- 2 or several connected devices → for instance to see which duplexer variant fits better with which AND/XOR gate variant
- overall system → to see if everything together still works
we have developed such a modular system in matlab:
- the current implementation defines modules at device level (reusable complexes is a pending issue)
- modules mainly are characterized by number/kind of input and output and can be simulated with an appropriate simulation function
- input/output kind: we destiguish between concentration and rate (PoPS)
- the modules have 1-2 inputs/ouptus, for instance 2 inputs/1 ouptut for AND/XOR gate
parameter estimation & sensitivity analysis
it is known, and we have made the same (sometimes painful) experience that parameter estimation is the most difficult and laborious part. most parameters are simply not known, and finding an at least roughly appropriate value sometimes approaches playing dice.
one way to address this problem is sensitivity analysis: if we change some parameter, what effect has it on the behavior of the model? we therefore perturbed all parameters and observed the change of the module output. the sensitivity matrix S can be computed with the jacobian matrices of the ode's with respect to the states (concentrations) and parameters. to be able to compare the results, parameter values are normalized, that is, parameter changes are relative to the assumed parameter value.
sensitivity analysis enables to determine:
- if our model resembles the desired behavior
- unnecessary parameters (can be eliminated)
- contribution of parameters to output behavior (which are the most sensitive parameters)
- validation of expected sensitivity, e.g.
- changing the second input of the AND gate if the first is low should have little influence (and thus low sensitivity)
- correlations: if sensitivity on input is low, parameters correlating with (acting on) the input should be low, too
the role of modeling
system deployment
distribution on the plasmids, strains
system assembly procedure
system test procedure
system test results
device level
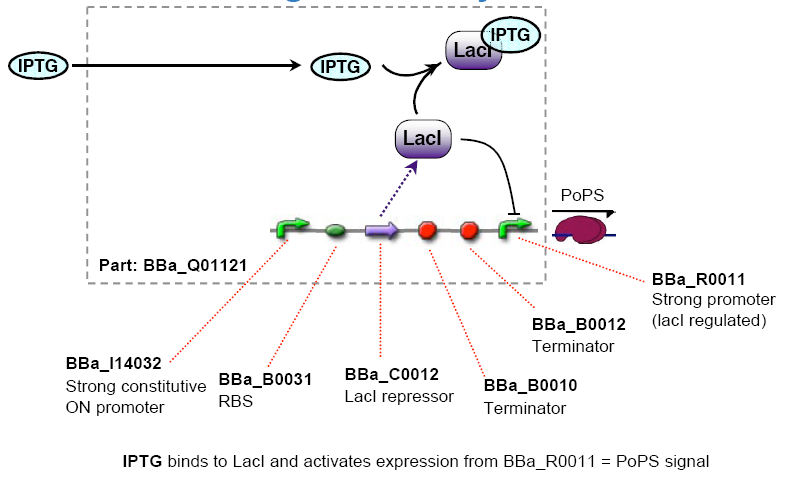
chemical sensing device
The chemical sensing device's PoPs output activity should be a monotonic function of the concentration of a certain substance in the cell's environment.
implementation alternatives
- Lactate lacI represses, IPTG induces (BBa_R0011 or BBa_R0010 )
- Tetracycline, TetR inhibitor, Tet inducer by inhibiting TetR (or aTc, it's analog) (BBa_R0040)
- combination thereof (BBa_I13614 / BBa_13617 / BBa_I13623 / BBa_I13624 / BBa_I13627 / BBa_I13637 / BBa_I13653)
- simple sugar Arabinose (BBa_R0080)
I see the main difficulty in the spatial separation as the cells are growing in the petri dishes. since the inducers are water-soluble we would have to fix the chemicals onto the petri dish.
assembly procedure
where we got it and link to theyer documentation
Progress:
- 2006/10/03
- Made LB-Agar plates with antibiotics
- 2006/10/04
- Transformed cells, plated them
- 2006/10/05
- Found plates empty after 18h on the table, put into incubator at 37°C
- 2006/10/06
- picked cultures onto fresh plates
test procedure
test results
light sensing device
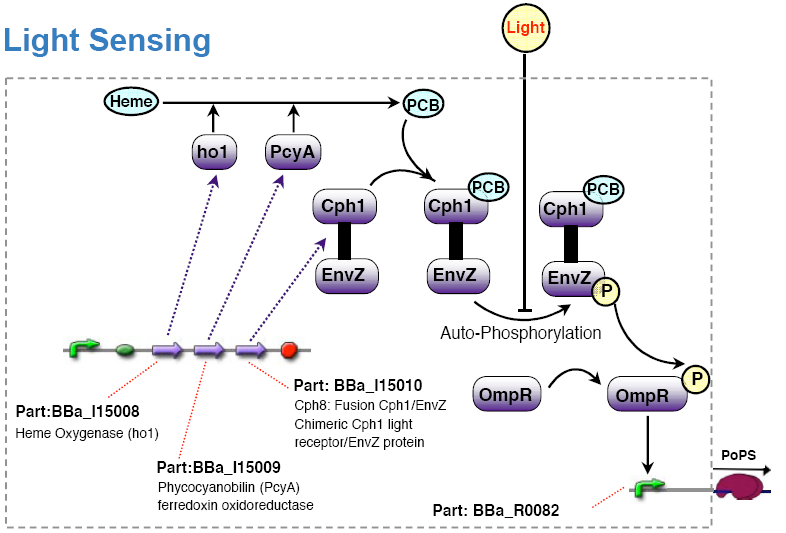
The light sensing device's PoPs output activity should be a monotonic function of the light intensity the cell is subjected to.
implementation alternatives
show how the existing light sensing device fullfills our specifications.
remarks
- the light sensing device is low active, that is:
no light results in high PoPS output, exposure to light in low PoPS - light sensing device taken from coliroid project, see
assembly procedure
Olga got the strain RU1012(KmR) and the plasmids pCPH8(CmR) and pPL-PCB(AmpR) from Christopher Voigt <cavoigt at picasso.ucsf.edu> [Engineering Escherichia Coli to see light; Nature vol. 438.].
A autonomous light sensing system can be obtained by cloning those two plasmids into the strain.
- plate RU1012 on LB+Km
- pick RU1012 cultures -> 5ml liquid culture (LB+Km)
-
- inoculate 200ml liquid culture
- grow for 3h
- wash twice (that means centrifuge, pipet off the liquid, dissolve in fresh LB?)
- make them competent
- make samples
- transform with both pCPH8 and pPL-PCB
- plate on
- LB+Cm
- LB+Ap
- LB+Ap+Cm
-
- if cultures survive on the Ap+Cm plate inoculate liquid culture 5ml LB+Km
- run tests
test procedure
- plate saturated liquid culture out on LB+envZ(15mg/50ml) plates.
- wrap one plate in something opaque, expose both plates to light at 37°C.
- the colonies on the wrapped plate should remain colorless, the ones exposed to light should become dark.
In the auxiliaries to the nature publication they state regarding theyer light source: ".1331 W/cm^2 from 620-680nm (active state of the phytochrome) and .0132 W/cm^2 from 715-755nm (inactive state of the phytochrome)". 715-755nm is near infrared, 620-680nm is red. The best matching commonly available light sources I can find would be [red LED] [white fluorescent light] and [indirect skylight]. A simple battery driven LED light source should be trivial to assemble, appropriate to put in the incubator, but not very powerful. A compact fluorescent light would be more appropriate but harder to get.
assembly progress
- 2006-10-16
- 2006-10-17
- picked a RU1012 colony and inoculated a 5ml liquid culture (LB+Km), plate in fridge --Ajk
- 2006-10-18
- diluted the RU1012 liquid culture to 200ml and incubated it again --Ajk
- it turned out that my interpretation of the lab procedure notes I got was too minimalistic, had to set up a new 3ml liquid LB culture from another colony on the plate made th 16th. --Ajk
- 2006-10-19
- diluted yesterdays liquid culture to 2x50ml and grew it up to OD600=~.4 --Ajk
- poured plates 2x Amp and 4x Cm+Amp --Ajk
- washed the cultures twice with water, once with 10% glycerol --Ajk
- one shot of electroporesis with both pPCB and pCPH8 and one control without plasmids, leftover RU1012 in -80°C --Ajk
- plated on 4x Cm+Amp, 2x Cm, 2x Amp, control: 1x Cm, 1x Km leftover transformed cells in fridge --Ajk
- 2006-10-20
- found colonies on all plates except the Cm control which is perfect!! picked one of the colonies from a Cm+Amp plate into a 5ml liquid LB+Km culture for testing. --Ajk
- poured 2x LB+Km+envZ plates --Ajk
- 2006-10-21;
- plated 100ul liquid culture onto each of the LB+Km+envZ plates, wrapped one of them in tin foil and incubated both --Ajk
- 2006-10-23
- mounted the plates with bacteria-side towards the light source to a white fluorescent lamp for approx 6h --Ajk
test results
The unwrapped plate stayed clear throughout the tests. The wrapped plate was deeply blue when it was inspected at the end. Apperently there was enough light in the occasionally opened incubator (opaque door!) to inhibit lacZ expression. --Ajk 11:29, 23 October 2006 (EDT)
logic (half adder) device
Registry: BBa_J34000
As stated in the #system behavorial specification the logic is made up of one AND and one XOR gate, which are each another device, plus two copy devices to replicate the inputs:
       [          ]------>[     ]
A >----[ 1:2 copy ]       [ AND ]----> X
       [          ]--, ,->[     ]
                      X
       [          ]--' '->[     ]
B >----[ 1:2 copy ]       [ XOR ]----> Y
       [          ]------>[     ]
reporters
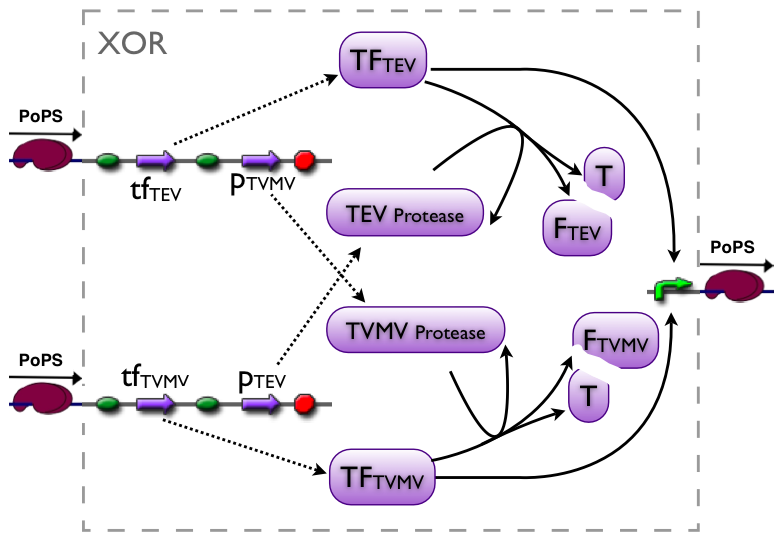
XOR gate
The XOR gate's PoPs output activity should be correlated to the PoPs input activity as shown in the picture:
 input A ^
         | H  D  L
         | D  D  D
         | L  D  H
         +--------->
            input B

 output: High, Low, Dont care
implementation alternatives
Part to be used in the prototype system: BBa_J34200
modeling
assembly procedure
test procedure
test results
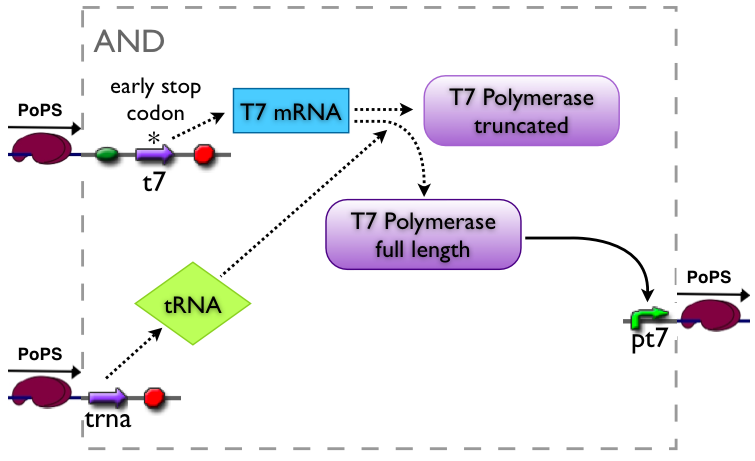
AND gate
The AND gate's PoPs output activity should be correlated to the PoPs input activity as shown in the picture:
 input A ^
         | L  D  H
         | D  D  D
         | L  D  L
         +--------->
            input B

 output: High, Low, Dont care
implementation alternatives
Part to be used in the prototype system: BBa_J34100
modeling
assembly procedure
test procedure
test results
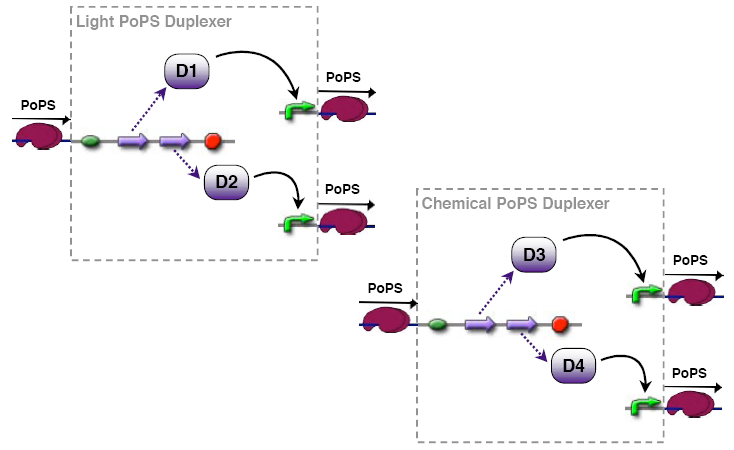
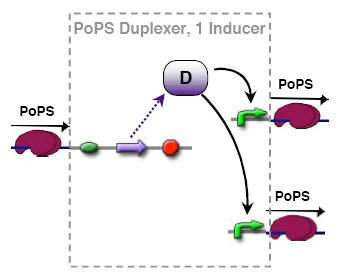
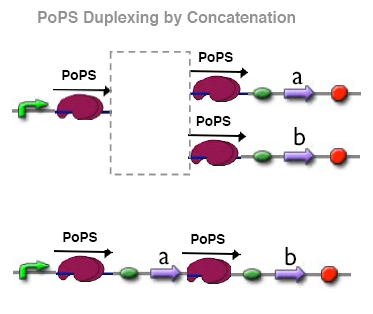
PoPs duplexer device
This device has two PoPs outputs which should in terms of activity be copies of the input.
implementation alternatives
modeling
assembly procedure
test procedure
test results
parts level
for every part we use:
- DNA sequence
- where we got it from
(links to the registry)
Maybe this could mostly be a hierarchy of links to the registry because it's preferable to have as much documentation in the registry as possible anyway. This is nice because it emphases our incredibly systematic engineering approach and documents the processes too which could also serve for coordination of the work in progress.
modeling
The contents of this section should be placed at the appropriate places in the design process section above and the rest moved to an external page.
Matlab scripts for ODE simulation
modular scripts
- contains a
createXXX()script for each module. the created module contains- function handles for reaction rates: r
- stoichiometric matrix: N
- constants (inside of the function handles)
- state (concentration) changes (the ode dy values) can be computed by: N · r
- modules can be connected using the
createInOutConnector()script. the result is again a module, consisting of the connected basic modules. -
sim_1_1andsim_1_2can be used to simulate modules with 1 input/1 output and 1 input/2 outputs respectively. - both basic modules and compound (connected) modules can be simulated
-
simulationscontains the first samples, simulating- XOR → simulation results / sensitivity analysis
- AND-tRNA → simulation results / sensitivity analysis
- IPTG Sensing →simulation results
- PoPS Duplexer →simulation results
- Compound module: IPTG Sensing → PoPS Duplexer →simulation results
- scripts: matlab_modules.zip (<0.1M)
old scripts
unzip the file, each zip file contains 2 files: sim_xxx.m and ode_xxx.m.
-
ode_xxx.m: contains the differential equations, i.e. the model -
sim_xxx.m: sets the parameters, calls the simulator and plots the result (this is the one to run, but the other is also needed).
- matlab_sim_and1.zip (<0.1M) →simulation results → abandoned
- matlab_sim_and2.zip (<0.1M) →simulation results → the pursued version A
- matlab_sim_and3.zip (<0.1M) →simulation results → the pursued version B
- matlab_sim_and4.zip (<0.1M) →simulation results → abandoned
As a result of the meeting on August 17, we will from now on concentrate on the AND versions 2 and 3.
- matlab_sim_xor1.zip (<0.1M) →simulation results → the only pursued version
- matlab_sim_xor2.zip (<0.1M) →simulation results → abandoned
- matlab_sim_xor3.zip (<0.1M) →simulation results → abandoned
Sensoring
- matlab_sim_iptg.zip (<0.2M) →simulation results
