ETH2006 xor
From 2006.igem.org
m (→early simulation results of variants) |
m (→implementation alternatives) |
||
| Line 19: | Line 19: | ||
{| | {| | ||
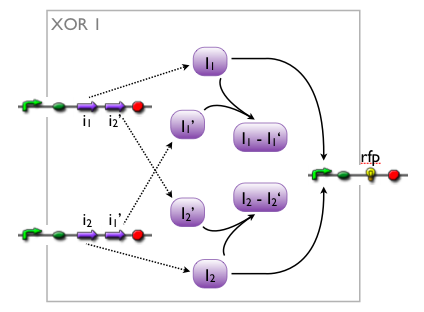
| - | | [[Image:ETH_XOR1.png| |center|XOR gate, implementation variant 1]] | + | | [[Image:ETH_XOR1.png|350px|center|XOR gate, implementation variant 1]] |
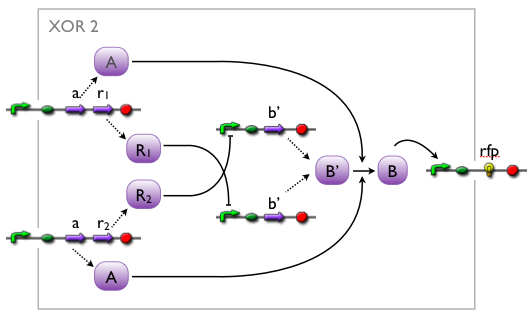
| - | | [[Image:ETH_XOR2.png| |center|XOR gate, implementation variant 2]] | + | | [[Image:ETH_XOR2.png|400px|center|XOR gate, implementation variant 2]] |
|} | |} | ||
Revision as of 11:43, 28 October 2006
Contents |
XOR gate
The XOR gate's PoPs output activity should be correlated to the PoPs input activity as shown in the picture:
 input A ^
         | H  D  L
         | D  D  D
         | L  D  H
         +--------->
            input B

 output: High, Low, Dont care
implementation
implementation alternatives
when we knew that we were going to implement an XOR, we came up with different artificial variants, without knowing whether such a system would exist in biology or not. while our biologists started searching the literature, we modelled the variants to see which we might want to favor.
here, we pick out 2 variants with corresponding simulation results to give an idea of the process of development. note that at this stage, the models still contain minor inaccuracies such as missing ribosome binding sites, which we corrected later on.
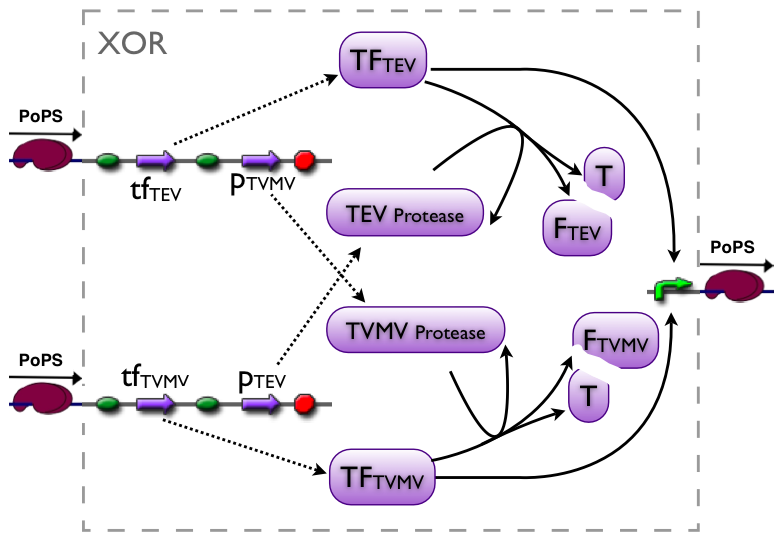
further development of the first variant resulted in the current implementation of the XOR gate.
current
Part to be used in the prototype system: [http://partsregistry.org/Part:BBa_J34200 BBa_J34200]
modeling
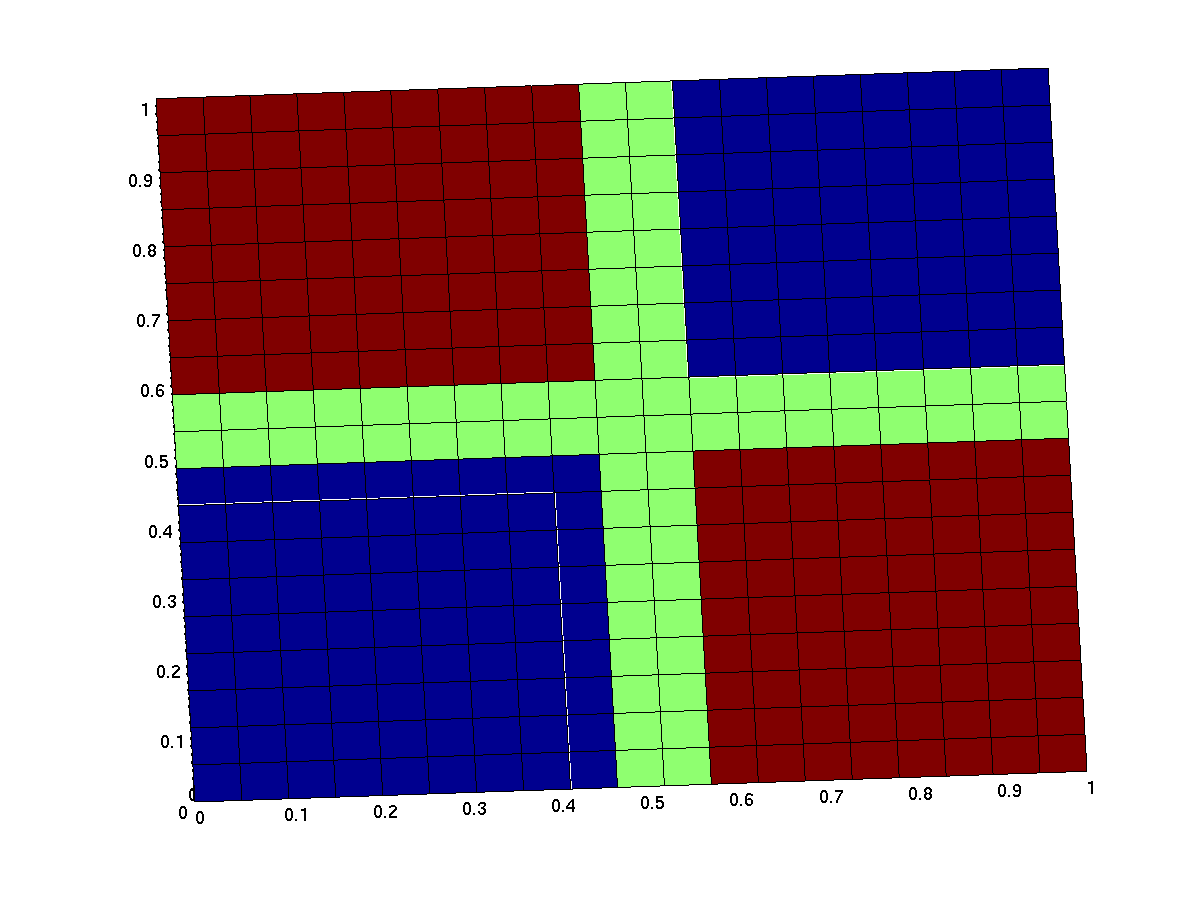
we are interested in the input/output behavior at steady state, that is when the system has reached equilibra and the concentrations of concerned species don't change anymore. since we have 2 inputs and 1 ouptut, simulation results will be illustrated as a surface plot, inputs on the x/y axes and output on the z axis.
ideal xor gate
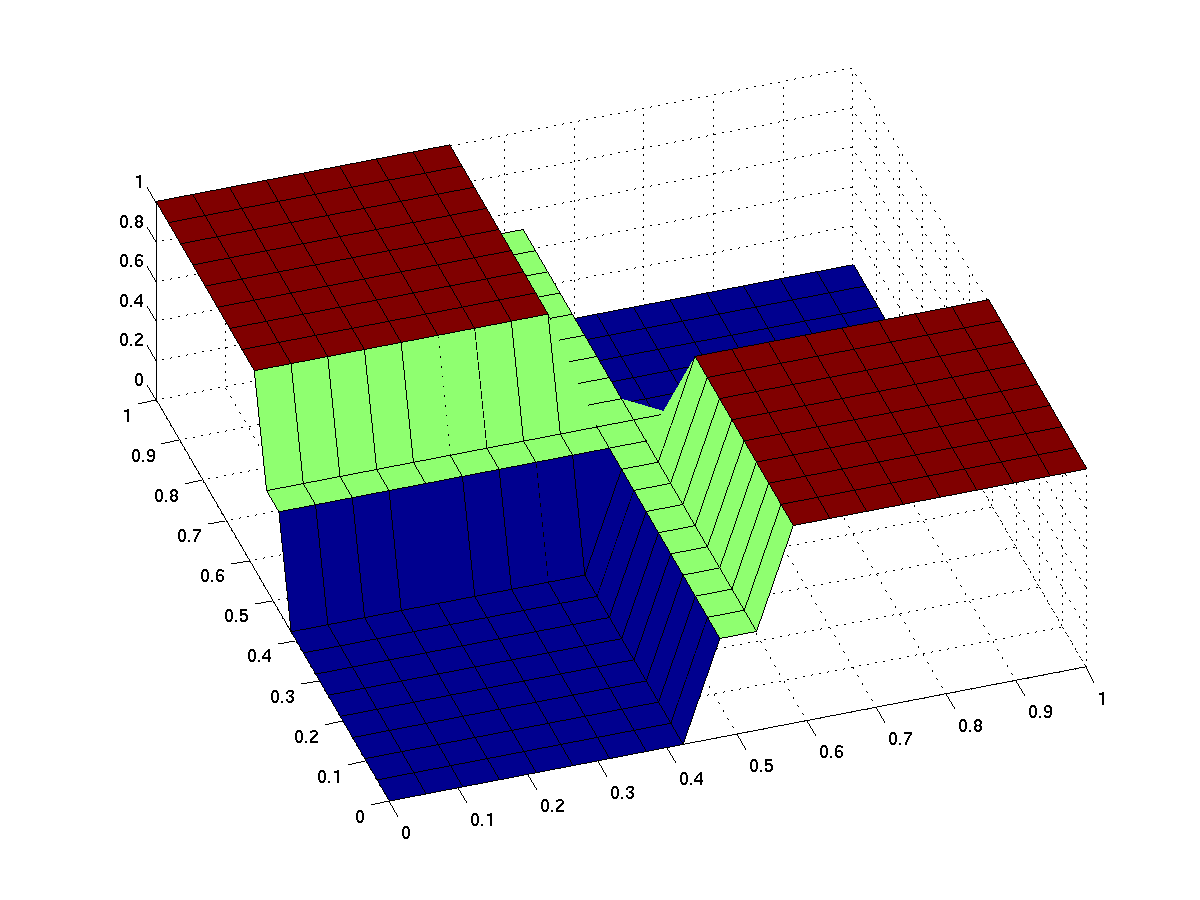
the expected input/output behavior of an ideal xor gate looks like this (with less green being better):
note that the anterior low (blue) part has low inputs, the rear one has high inputs.
early simulation results of variants
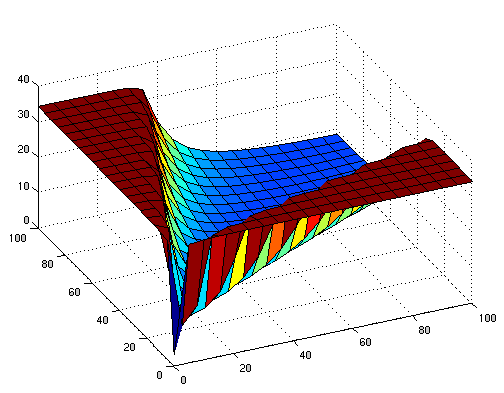
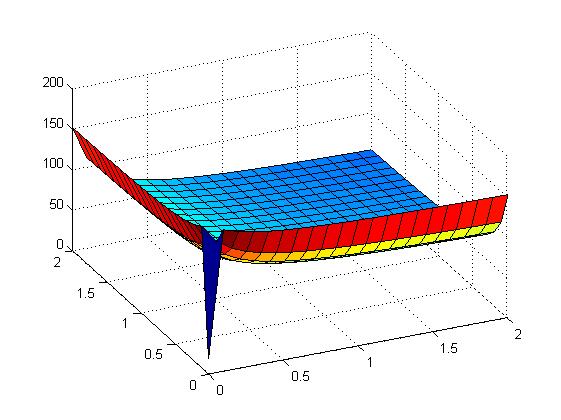
the following figures show early simulation results of the implementation variants 1 and 2. note that also the models contain inexactness and even defects at this stage.
| Variant 1 | Variant 2 |
| surface plot of simulation results for XOR variants 1 and 2 | |
both plots show behaviors far from that of the ideal XOR gate, but the first variant at least has high output if one or the other, but not both inputs are high. further on, the first variant seemed to be less sensitive to parameter changes. in fact, it was very hard to find any parameter values for model 2 at all which showed XOR-like behavior at least in the broadest sense.
not only because of these results (biology also had a voice in this chapter), but definitely backing the decision, we went for variant 1 from here on.
current simulation results
sensitivity analysis
more (old) simulation results
simulation results / sensitivity analysis
assembly procedure
test procedure
test results
parts
[http://partsregistry.org/Part:BBa_J34100 BBa_J34100]
