Results
From 2006.igem.org
(Difference between revisions)
| Line 16: | Line 16: | ||
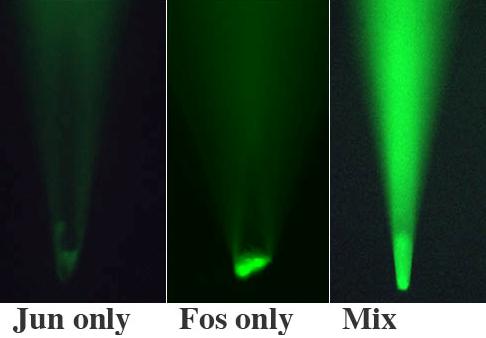
[[Image:Results2.JPG|frame|left|Figure 2. Mixing of Jun- and Fos-expressing cells in a culture dish using a patch pipette. The phase contrast image shows a concentrated solution of Jun-expressing cells alone; the middle panel shows the fluorescence from these cells. In the right-hand panel, Fos was added from gentle pressure against the patch pipette approximately 60 s before the image was taken.]] | [[Image:Results2.JPG|frame|left|Figure 2. Mixing of Jun- and Fos-expressing cells in a culture dish using a patch pipette. The phase contrast image shows a concentrated solution of Jun-expressing cells alone; the middle panel shows the fluorescence from these cells. In the right-hand panel, Fos was added from gentle pressure against the patch pipette approximately 60 s before the image was taken.]] | ||
| + | |||
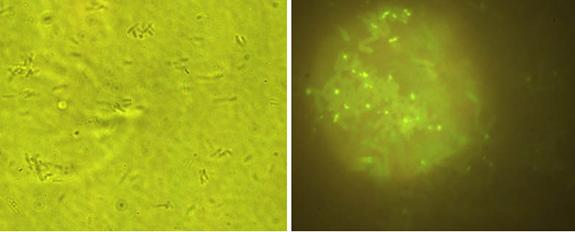
[[Image:Results3.JPG|frame|left|Figure 3. Cell clustering and pattern of fluorescence. Sometimes, but not always, mixing of the Fos- and Jun-expressing cells leads to the formation of cell clusters. In the right-hand panel, a fluorescence image of one of the clusters shows a speckled fluorescence pattern.]] | [[Image:Results3.JPG|frame|left|Figure 3. Cell clustering and pattern of fluorescence. Sometimes, but not always, mixing of the Fos- and Jun-expressing cells leads to the formation of cell clusters. In the right-hand panel, a fluorescence image of one of the clusters shows a speckled fluorescence pattern.]] | ||
| + | |||


