ETH2006 xor
From 2006.igem.org
m (→sensitivity analysis) |
m |
||
| Line 14: | Line 14: | ||
output: High, Low, Dont care | output: High, Low, Dont care | ||
| - | === | + | === Implementation === |
| - | ==== | + | ==== Implementation alternatives ==== |
| - | + | We came up with a number of concepts for the implementation of the XOR, initially without considering the existence such biological systems. Then, while our biologists started searching the literature, we modelled the variants to see which we might want to favor. | |
| - | + | Here we pick out two variants with corresponding simulation results to give an idea of the process of development. Note that at this stage, the models still contain minor inaccuracies such as missing ribosome binding sites, which we corrected later on. | |
{| | {| | ||
| Line 25: | Line 25: | ||
|} | |} | ||
| - | + | Further development of the first variant resulted in the current implementation of the XOR gate. | |
| - | ==== | + | ==== Current implementation ==== |
Part to be used in the prototype system: [http://partsregistry.org/Part:BBa_J34200 BBa_J34200] | Part to be used in the prototype system: [http://partsregistry.org/Part:BBa_J34200 BBa_J34200] | ||
| Line 40: | Line 40: | ||
References: | References: | ||
| - | + | * Hu JC, Kornacker MG, Hochschild A. Escherichia coli one- and two-hybrid systems for the analysis and identification of protein-protein | |
interactions. Methods. 2000 Jan;20(1):80-94. | interactions. Methods. 2000 Jan;20(1):80-94. | ||
| - | + | * Nallamsetty S, Kapust RB, Tozser J, Cherry S, Tropea JE, Copeland TD, Waugh DS. Efficient site-specific processing of fusion proteins by tobacco vein mottling virus protease in vivo and in vitro. Protein Expr Purif. 2004 Nov;38(1):108-15. | |
| - | + | * Kapust RB, Waugh DS. Controlled intracellular processing of fusion proteins by TEV protease. Protein Expr Purif. 2000 Jul;19(2):312-8. | |
| - | + | * Hochschild A., personal communication | |
| - | + | ||
| - | + | ||
| - | + | ||
| - | + | ||
[[Image:ETH xor.png|400px|center|current XOR gate implementation]] | [[Image:ETH xor.png|400px|center|current XOR gate implementation]] | ||
| - | === | + | === Modeling === |
| - | + | We are interested in the input/output behavior at steady-state, that is when the system has reached equilibra and the concentrations of concerned species don't change anymore. Since we have 2 inputs and 1 ouptut, simulation results will be illustrated as a surface plot, inputs on the x/y axes and output on the z axis. | |
| - | ==== | + | ==== Ideal xor gate ==== |
| - | + | The expected input/output behavior of an ideal xor gate looks like this (better with less green and steeper flanks): | |
{| | {| | ||
| Line 67: | Line 63: | ||
| colspan="2" align="center" | ''behavior of an ideal XOR gate''<br/>(x/y: ''inputs'', z: ''output'') | | colspan="2" align="center" | ''behavior of an ideal XOR gate''<br/>(x/y: ''inputs'', z: ''output'') | ||
|} | |} | ||
| - | + | Note that the anterior low (blue) part has low inputs, the rear one has high inputs. | |
| - | ==== | + | ==== Early simulation results of variants ==== |
| - | + | The following figures show early simulation results of the implementation variants 1 and 2. Note that also the models contain inaccuracies and even defects at this stage. | |
{| | {| | ||
| Line 82: | Line 78: | ||
|} | |} | ||
| - | + | Both plots show behaviors far from that of the ideal XOR gate, but the first variant at least has high output if one or the other, but not both inputs are high. Further on, the first variant seemed to be less sensitive to parameter changes. In fact, it was very hard to find ''any'' parameter values for model 2 ''at all'' which showed XOR-like behavior at least in the broadest sense. | |
| - | + | Not only because of these results (biology also had a voice in this chapter), but definitely backing the decision, we went for variant 1 from here on. | |
| - | ==== | + | ==== Current simulation results ==== |
{| | {| | ||
|- | |- | ||
| Line 98: | Line 94: | ||
|} | |} | ||
| - | + | For every plot, 25 (left) / 100 (middle, right) ODE simulations were performed, simulating a time period of 12h. Simulations with 2h / 5h halflife period for proteins have been run, showing little difference in the outcome, though. Complete parameter allocation can be found in the [[ETH_Simulation_Scripts|matlab scripts]] as well as the system of ordinary differential equations (ODEs). | |
| - | + | The input rates (PoPS) have been chosen in the range of mRNA transcription rate, which was estimated according to the following assumptions: | |
* ''E.coli'' cytoplasm volume is approximately 6.7*10<sup>-16</sup> l | * ''E.coli'' cytoplasm volume is approximately 6.7*10<sup>-16</sup> l | ||
* average number of mRNA molecules: 10 | * average number of mRNA molecules: 10 | ||
* → concentration<sub>mRNA</sub> = 10/(6.7*10<sup>-16</sup> * 6.022*10<sup>23</sup>) M = 0.0248 μM | * → concentration<sub>mRNA</sub> = 10/(6.7*10<sup>-16</sup> * 6.022*10<sup>23</sup>) M = 0.0248 μM | ||
| - | * at equilibrum, mRNA rate and degredation balance each other. | + | * at equilibrum, mRNA rate and degredation balance each other. Assuming half life period of 30min for mRNA, the result is<br/>→rate<sub>mRNA</sub> = concentration<sub>mRNA</sub> * log(2)/30 μM/min = 5.7265e-04 μM/min |
| - | + | Amplifying/damping the input rates by small constant factors has influence on the qualitative outcome of the simulation. | |
* it is thus important to know how strong the input of the gate has to be. | * it is thus important to know how strong the input of the gate has to be. | ||
* we can regulate this by choosing/designing the predecessor gate accordingly or | * we can regulate this by choosing/designing the predecessor gate accordingly or | ||
* by changing the ribosome binding sites to strengthen/weaken the input signal. | * by changing the ribosome binding sites to strengthen/weaken the input signal. | ||
| - | + | We accounted for this by adding restriction enzyme sites to the DNA. | |
| - | + | In order to find out about other important, say ''sensitive'' parameters, we wanted to do this more systematically. The keyword has already been given: sensitivity analisys. | |
| - | ==== | + | ==== Sensitivity analysis ==== |
{| | {| | ||
| Line 126: | Line 122: | ||
|} | |} | ||
| - | ==== | + | ==== More (old) simulation results ==== |
[[ETH_Sim_Mod_Xor|simulation results]] / [[ETH_Sens_Xor|sensitivity analysis]] | [[ETH_Sim_Mod_Xor|simulation results]] / [[ETH_Sens_Xor|sensitivity analysis]] | ||
| - | === | + | === Assembly procedure === |
| - | === | + | === Test procedure === |
| - | === | + | === Test results === |
| - | === | + | === Parts === |
[http://partsregistry.org/Part:BBa_J34200 BBa_J34200] | [http://partsregistry.org/Part:BBa_J34200 BBa_J34200] | ||
→[[ETH Zurich 2006#System modeling|back to main page]] | →[[ETH Zurich 2006#System modeling|back to main page]] | ||
Revision as of 14:17, 29 October 2006
Contents |
XOR gate
The XOR gate's PoPs output activity should be correlated to the PoPs input activity as shown in the picture:
 input A ^
         | H  D  L
         | D  D  D
         | L  D  H
         +--------->
            input B

 output: High, Low, Dont care
Implementation
Implementation alternatives
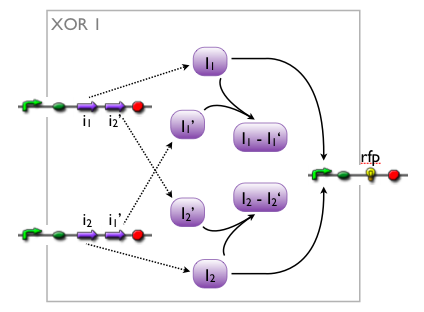
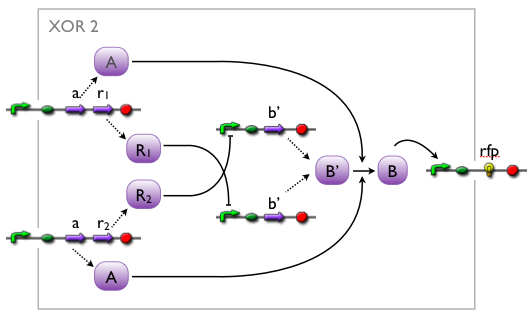
We came up with a number of concepts for the implementation of the XOR, initially without considering the existence such biological systems. Then, while our biologists started searching the literature, we modelled the variants to see which we might want to favor.
Here we pick out two variants with corresponding simulation results to give an idea of the process of development. Note that at this stage, the models still contain minor inaccuracies such as missing ribosome binding sites, which we corrected later on.
Further development of the first variant resulted in the current implementation of the XOR gate.
Current implementation
Part to be used in the prototype system: [http://partsregistry.org/Part:BBa_J34200 BBa_J34200]
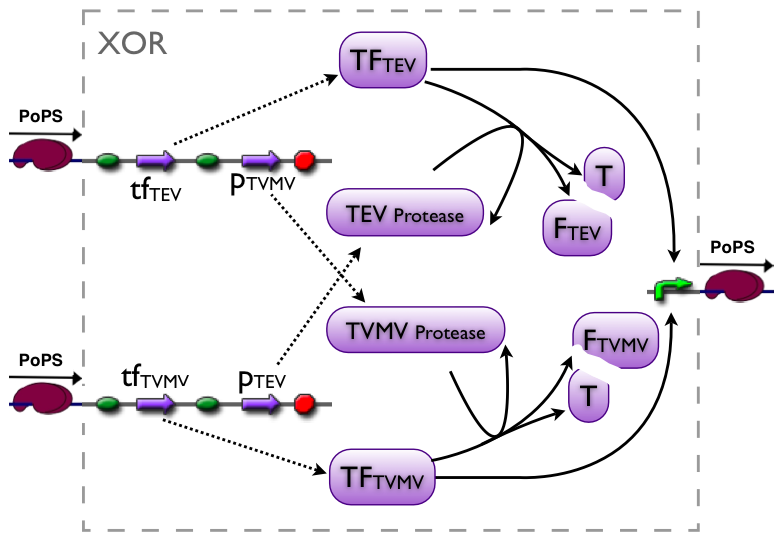
An XOR gate produces an output only if one of the two possible input signals is present. In our implementation the gene expression triggered by Signal 1 inhibits the gene expression triggered by Signal 2 and vice versa.
Signal 1 leads to the expression of a bi-modular transcription factor where the DNA binding domain is separated from the transcriptional activation domain by a Tobacco Etch Virus (TEV) protease cleavage site. Moreover, Signal 1 triggers the expression of the highly sequence-specific Tobacco Vein Mottling Virus (TVMV) protease. On the other hand, Signal 2 leads to the expression of an almost identical transcription factor, but in this case the DNA binding domain is separated from the transcriptional activation domain by a TVMV protease cleavage site. In addition, Signal 2 induces the transcription of the TEV protease. Therefore, the presence of either one of the signals leads to a stable transcription factor, which can initiate the transcription of a downstream reporter, while the presence of both signals leads to the mutual cleavage of both transcription factors by the specific proteases.
Our bi-modular transcription factor consists of the DNA binding domain of the bacteriophage lambda repressor protein (λcI) fused to the N-terminal domain of the RNA polymerase α subunit. Binding of this transcription factor to its cognate promoter – the λ operator – initiates the transcription of a downstream reporter (in this case GFP).
The DNA binding domain (λcI) of the transcription factor is linked to N terminal domain of the α subunit of the RNA polymerase by a linker sequence consisting of three alanines, followed by the cognate protease cleavage sites and two alanines (AAA protease cleavage sequence AA).
References:
- Hu JC, Kornacker MG, Hochschild A. Escherichia coli one- and two-hybrid systems for the analysis and identification of protein-protein
interactions. Methods. 2000 Jan;20(1):80-94.
- Nallamsetty S, Kapust RB, Tozser J, Cherry S, Tropea JE, Copeland TD, Waugh DS. Efficient site-specific processing of fusion proteins by tobacco vein mottling virus protease in vivo and in vitro. Protein Expr Purif. 2004 Nov;38(1):108-15.
- Kapust RB, Waugh DS. Controlled intracellular processing of fusion proteins by TEV protease. Protein Expr Purif. 2000 Jul;19(2):312-8.
- Hochschild A., personal communication
Modeling
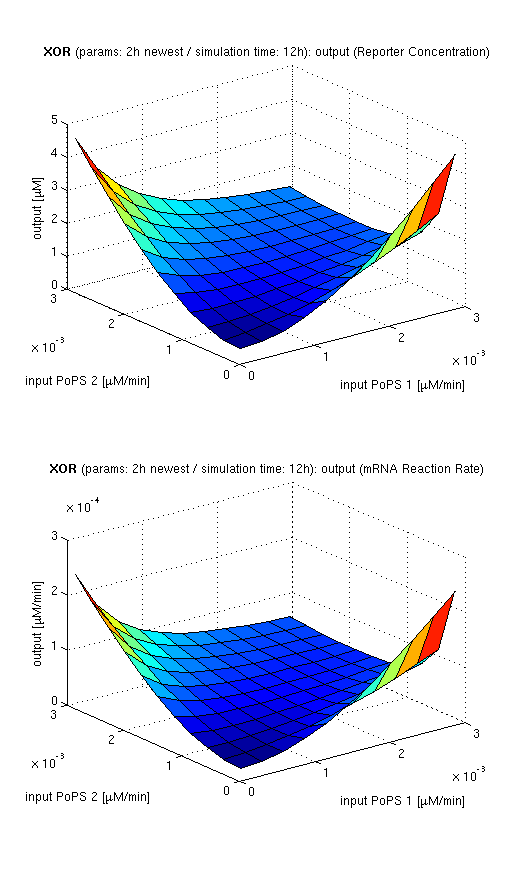
We are interested in the input/output behavior at steady-state, that is when the system has reached equilibra and the concentrations of concerned species don't change anymore. Since we have 2 inputs and 1 ouptut, simulation results will be illustrated as a surface plot, inputs on the x/y axes and output on the z axis.
Ideal xor gate
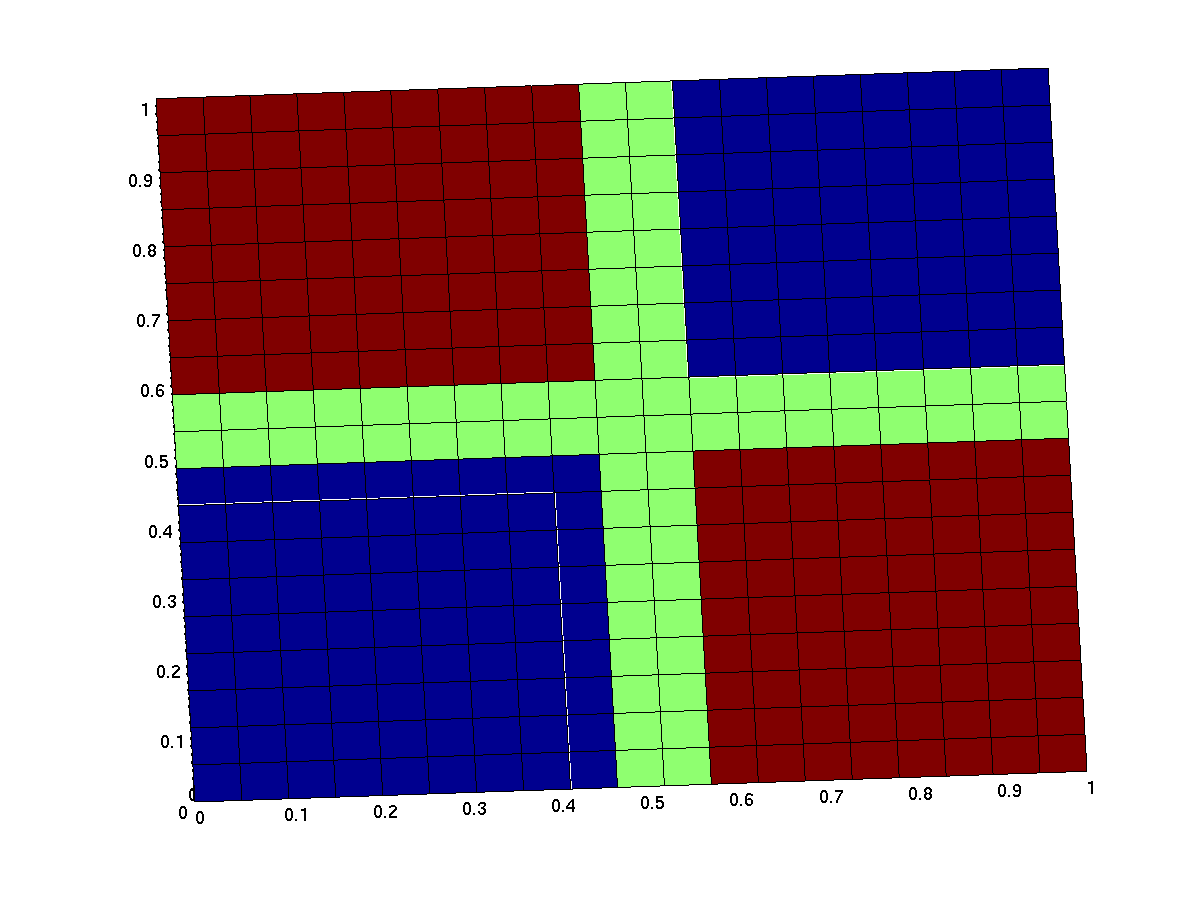
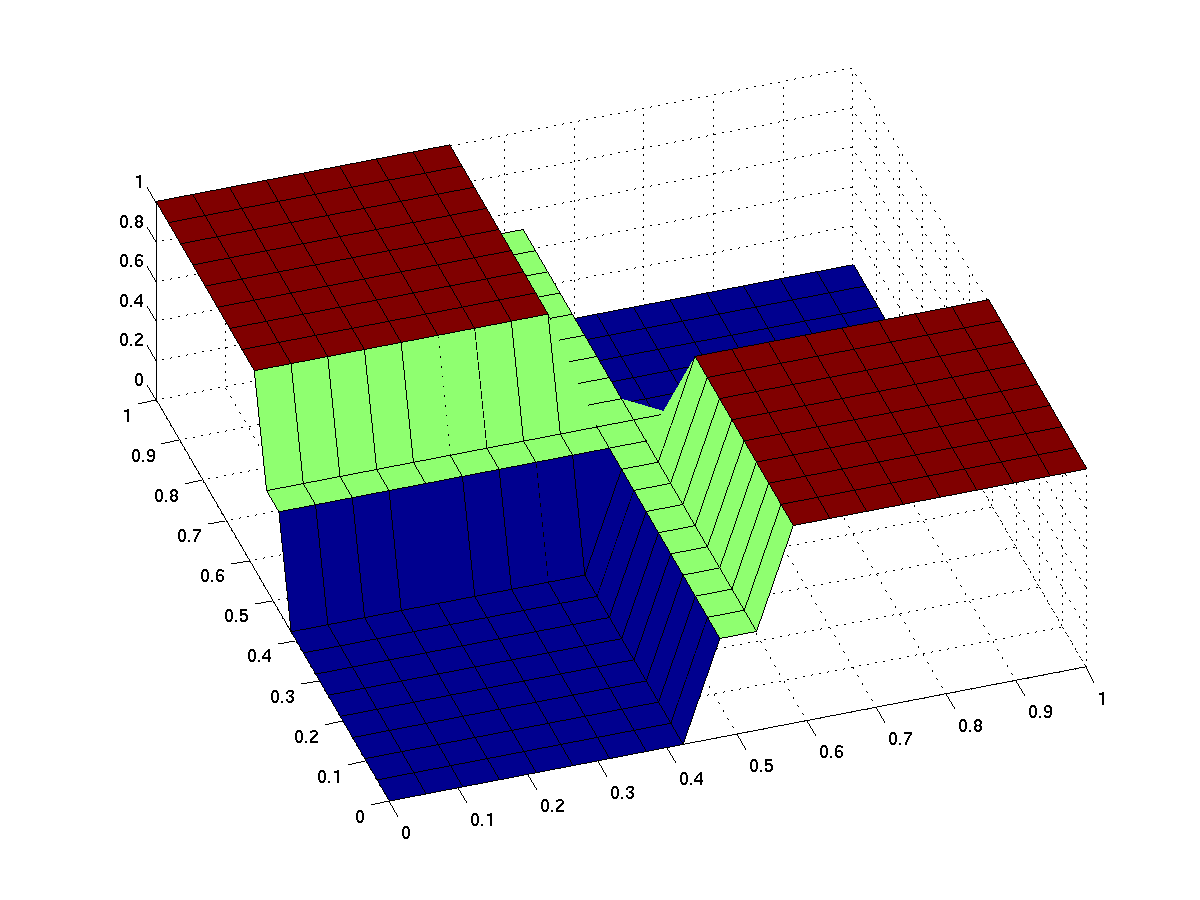
The expected input/output behavior of an ideal xor gate looks like this (better with less green and steeper flanks):
| topside view | 3d surface plot |
| behavior of an ideal XOR gate (x/y: inputs, z: output) | |
Note that the anterior low (blue) part has low inputs, the rear one has high inputs.
Early simulation results of variants
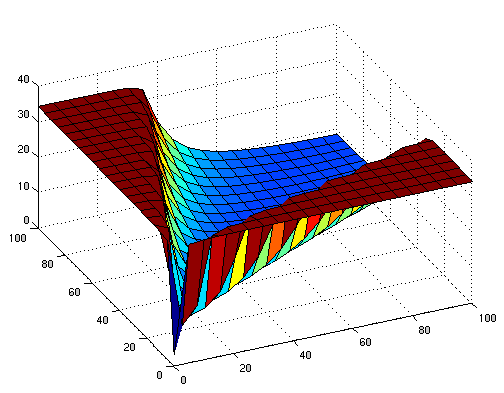
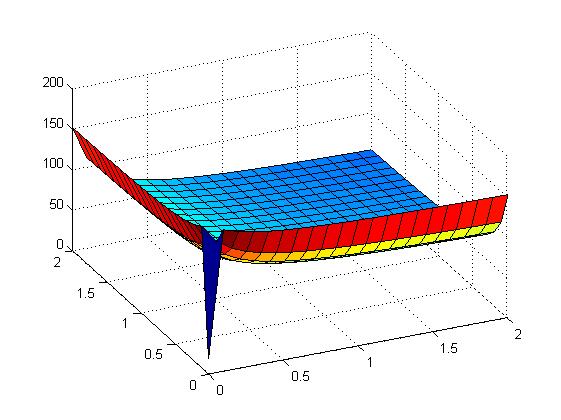
The following figures show early simulation results of the implementation variants 1 and 2. Note that also the models contain inaccuracies and even defects at this stage.
| Variant 1 | Variant 2 |
| surface plot of simulation results for XOR variants 1 and 2 (x/y: inputs, z: output) | |
Both plots show behaviors far from that of the ideal XOR gate, but the first variant at least has high output if one or the other, but not both inputs are high. Further on, the first variant seemed to be less sensitive to parameter changes. In fact, it was very hard to find any parameter values for model 2 at all which showed XOR-like behavior at least in the broadest sense.
Not only because of these results (biology also had a voice in this chapter), but definitely backing the decision, we went for variant 1 from here on.
Current simulation results
| topside view, htProt=2h | 3d surface plot, htProt=2h | 3d surface plot, htProt=5h |
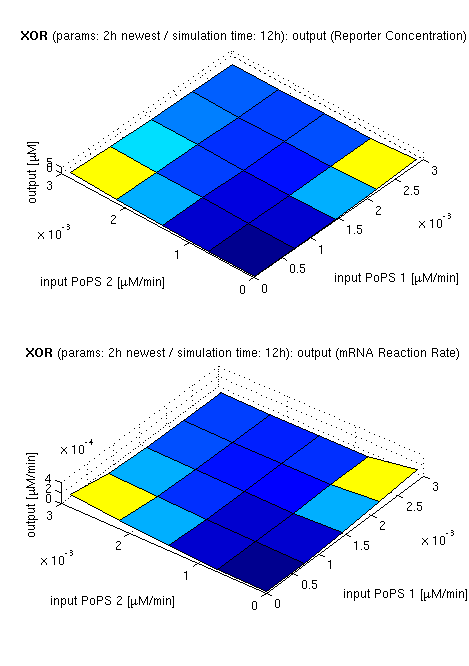
| simulation results for XOR gate, different protein halflife periods top / bottom: output (z axis) is mRNA rate (∼PoPS) / reporter concentration (x/y: inputs, z: output, htProt: protein halflife period) | ||
For every plot, 25 (left) / 100 (middle, right) ODE simulations were performed, simulating a time period of 12h. Simulations with 2h / 5h halflife period for proteins have been run, showing little difference in the outcome, though. Complete parameter allocation can be found in the matlab scripts as well as the system of ordinary differential equations (ODEs).
The input rates (PoPS) have been chosen in the range of mRNA transcription rate, which was estimated according to the following assumptions:
- E.coli cytoplasm volume is approximately 6.7*10-16 l
- average number of mRNA molecules: 10
- → concentrationmRNA = 10/(6.7*10-16 * 6.022*1023) M = 0.0248 μM
- at equilibrum, mRNA rate and degredation balance each other. Assuming half life period of 30min for mRNA, the result is
→ratemRNA = concentrationmRNA * log(2)/30 μM/min = 5.7265e-04 μM/min
Amplifying/damping the input rates by small constant factors has influence on the qualitative outcome of the simulation.
- it is thus important to know how strong the input of the gate has to be.
- we can regulate this by choosing/designing the predecessor gate accordingly or
- by changing the ribosome binding sites to strengthen/weaken the input signal.
We accounted for this by adding restriction enzyme sites to the DNA.
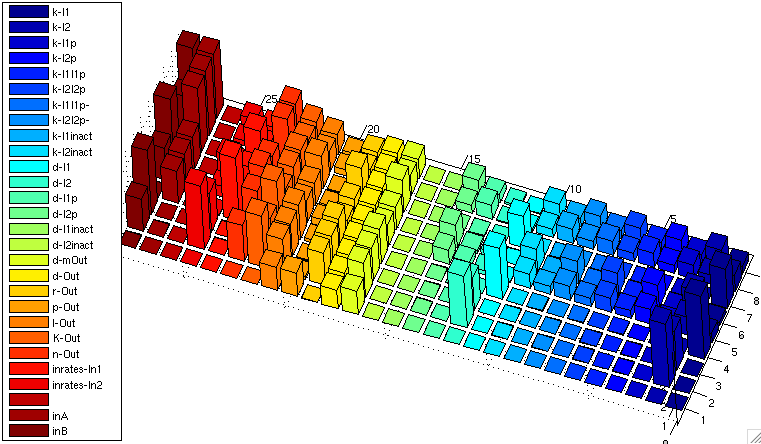
In order to find out about other important, say sensitive parameters, we wanted to do this more systematically. The keyword has already been given: sensitivity analisys.
Sensitivity analysis
| XOR: sensitivity analysis | |
| normalized sensitivity of the parameters for XOR gate | |
More (old) simulation results
simulation results / sensitivity analysis
Assembly procedure
Test procedure
Test results
Parts
[http://partsregistry.org/Part:BBa_J34200 BBa_J34200]
