Experiments
From 2006.igem.org
(→Results) |
(→Purpose) |
||
| Line 309: | Line 309: | ||
==Experiment 2005/10/31: LEICA-03== | ==Experiment 2005/10/31: LEICA-03== | ||
===Purpose=== | ===Purpose=== | ||
| - | Observe single cells under the | + | Observe single cells under the [http://www.lmc.ethz.ch/Instruments/Microscopes/Leica_SP2_AOBS| Leica SP2 AOBS], which is a [http://en.wikipedia.org/wiki/Confocal_microscopy| confocal laser scanning microscope]. Estimate/confirm relative activity of Pr+GFP+Prm+RFP subsystem and the two complete systems with and without degradation tag for cI. Compare different pre and post concentrations of IPTG. |
===Samples=== | ===Samples=== | ||
Revision as of 13:02, 2 November 2005
Back to ETH Zurich main page.
NOTE: this page above all is currently under construction.
Contents
|
General Remarks
While putting together the Counter-system there are multiple experiments to carry out. One aspect is of course to test and prove the overall functionality. However, although the system we plan to implement consists largely of registry parts it will be new as a whole and it may well be very fragile due to its high complexity of interdependent parts and states. Thus it is far from assured whether the whole device will work in the end. For this reason it is sensible to test every single intermediate on the way to assure that a flaw is detected right away and not propagated through weeks of hard work - we will refer to this as testing and debugging, just like in software projects.
Another aspect - especially within the framework of Synthetic Biology - is the characterization of intermediate parts. One has to distinguish different aspects of the system: PoPS at the part interface tell you how much mRNA is produced per second and thus the efficiency of the promoter that is used (and the influence of possible additional factors like the roadblocks we will implement). However, PoPS might be different from the concentration of the actual proteins present in the cytoplasm due to variation in the translation efficiency. Another important detail is the stability and degradation rate of these proteins - especially for the possibly rather fragile system dynamics of our device.
Protein Properties of Interest
The system behavior obviously depends on the interdependent sequence of fluctuating protein concentrations. While for the mathematical modeling of our system and for Synthetic Biology as a whole low level parameters are important - such as production and degradation rates, binding affinity, cooperativity of dimers, etc. - the thing that we typically can observe are reporter protein concentrations. Some things we can deduce from these observations, others we can't. However, to keep track of this delicate interdependence of fluctuations we put a whishlist of what we would like to know and what we do know - strictly in the context of our system, that is.
| Protein | Production Rate | Degradation Rate | Max. Conc. | Min. Conc. |
| IPTG | adjustable: test | ? | adjustable: test | 0 |
| LacI+LVA | ? | ? | ? | ? |
| cI | ? | ? | ? | ? |
| cI+LVA | ? | ht = 4 min | ?: test | ?: test |
| GFP @Pr | ? | ? | ?: test | ?: test |
| GFP @Prm | ? | ? | ?: test | ?: test |
| RFP @Prm | ? | 20 years | ?: test | ?: test |
| YFP+LVA @? | ? | ? | ?: test | ?: test |
| CFP+LVA @? | ? | ? | ?: test | ?: test |
| XFP @Pr+ZFBSn (ZF i,k) | ? | ? | ?: test | ?: test |
| XFP @Prm+ZFBSn (ZF i,k) | ? | ? | ?: test | ?: test |
It is indeed a tedious task to measure these parameters, since most aspects of a biological system have to be observed indirectly over markers, e.g. fluorescent proteins. We are determined to carry out as many experiments to test and quantify as we can reasonably afford - but of course, this is mostly grey theory within the framework of this competition, since we are running out of both time and resources. The actual concentration and dynamics of proteins is the crucial factor for the system to work and thus the aspect we ultimately care about - as opposed to PoPS at the part level.
Focus of Experiments
Since Blue Heron is hopelessly delayed with the synthesis of the parts of the 4-State Device and does not seem to be able to deliver the samples, all we can do for now is to characterize parts of the Event Processing Device as they become available.
Quantification of Relative Pr and Prm Activity in Different States
There are two external states (simulated with IPTG in this prototype): normal activity in ground state (no IPTG present) and the simulation of an external event (IPTG present). An important aspect is the quantification of the relative activity of the key promoters, Pr and Prm, in these two states.
Ground State
We can compare the basal activity of the constitutively active Pr and the low basal activity of the inactive Prm by adding GFP (Green Fluorescent Protein) to both, parts [http://parts2.mit.edu/r/parts/partsdb/view.cgi?part_id=6125| S03335] and [http://parts2.mit.edu/r/parts/partsdb/view.cgi?part_id=6126| S03336], and measuring the statistical distribution of GFP intensity over a sample, i.e. a cell population, with [http://en.wikipedia.org/wiki/Fluorescent-activated_cell_sorting FACS] (Fluorescent-activated Cell Sorting). The instrument is the [http://www.bdbiosciences.com/immunocytometry_systems/products/display_product.php?keyID=53| BD FACSAria Cell-Sorting System]. We will also quantify Prm activity with RFP (Red Fluorescent Protein), i.e. part [http://parts2.mit.edu/r/parts/partsdb/view.cgi?part_id=6127| S03337], in order to have a comparison of relative intensities when carrying out measurements on the mixed system, see below.
External Event
Since we chose a very stable GFP for the initial prototype to make sure it is not degrading faster than it can be measured it is more difficult to quantify the repressed activity of Pr and the induced activity of Prm in presence of IPTG. We will try to inverse the states in certain cultures, i.e. parts [http://parts2.mit.edu/r/parts/partsdb/view.cgi?part_id=6131| J05503] and [http://parts2.mit.edu/r/parts/partsdb/view.cgi?part_id=6132| J05504], by adding IPTG already during [http://en.wikipedia.org/wiki/Transformation_(genetics)| transformation] (when the cells take in the plasmids) and thus inducing high cI production from the very beginning so that the stable GFP is not produced in the first place. Possibly (but unlikely) we can observe the dynamics of the system when IPTG is slowly degrading (it does't really) or is diluted (cell division, change of substrate) and Pr becomes active again and Prm is repressed. In any case we are cloning other GFP with degradation tags in parallel to Pr and Prm. Also we are planning to clone ECFP (cyan) and EYFP (yellow) with degradation tags and which can both be found in the current Registry 7.05 package we are using.
Estimate of Minimal IPTG Concentration/Degradation
For the efficient execution of later experiments it is useful to know the minimal concentration of IPTG that is needed to reach saturation of the cI production rate. Also, IPTG is by definition very stable. We are using it for the initial prototype because we could not be sure if we would see anything at all. Now that we know we have to estimate the degradation time of IPTG or rather find alternatives, such as Lactose (which degrades much faster).
Quantification of Lac-Input System
We use the LacI system in the registry as an interface to make the production of cI (the regulator which in turn controls Pr and Prm) dependent on an external event, i.e. the presence of IPTG. This input system is inactive in absence of IPTG. With part [http://parts2.mit.edu/r/parts/partsdb/view.cgi?part_id=6133| J05505] we will test the basic functionality with the reporter protein GFP: we hope to roughly quantify the basal activity and thus the minimal concentration of cI (due to leaking) compared to the active state in presence of IPTG and thus the maxium concentration of cI.
System Dynamics
If we have time, we will observe the dynamics of the input system with parts [http://parts2.mit.edu/r/parts/partsdb/view.cgi?part_id=6131| J05503] and [http://parts2.mit.edu/r/parts/partsdb/view.cgi?part_id=6132| J05504] with [http://en.wikipedia.org/wiki/Spectrofluorometer| spectrofluorometers], the FACS (quantification, statistics), and optical microscopes (tracking of specific single cells). The impact of different concentration levels of IPTG will be tested as well. If the inversion of intial states as described above does not work, we will use other parts with fast degrading fluorophores.
Measurements
To assure basic functionality and to characterize the intermediate parts, multiple additional parts, or "debugging" parts, have to be designed.
We have carried out multiple measurements while learning on the job about instruments, preparation procedures, and cell behavior. Only measurements with sensible results will be logged on this page.
In a first series of measurements we maintained 25° C during growth and preparation of the cell cultures in order to have consistent conditions on different measurement systems and to have a slower cell cycle. However, the preparation at these temperatures was very slow and we can not be sure that we see "real" production rates, since E. coli's niche is obviously some very constant 37° C. Thus we switched to 37° C for later experiments.
Experiment 2005/10/07: OM-01 / FM-01
Purpose
Verify basic functionality / success of cloning under the optical microscope and [http://en.wikipedia.org/wiki/Spectrofluorometer| spectrofluorometer]. Get a first rough idea of the relative activity of Pr and Prm.
Samples
- Pr ([http://parts2.mit.edu/r/parts/partsdb/view.cgi?part_id=189| R0051]) -> control
- Prm ([http://parts2.mit.edu/r/parts/partsdb/view.cgi?part_id=4799| I12007]) -> control
- Pr+GFP ([http://parts2.mit.edu/r/parts/partsdb/view.cgi?part_id=6125| S03335]) -> basal activity
- Prm+GFP ([http://parts2.mit.edu/r/parts/partsdb/view.cgi?part_id=6126| S03336]) -> basal activity (leakiness)
Expectations
We expect to see a clear difference in the activity of Pr in maximum activation and Prm in basal state.
Results
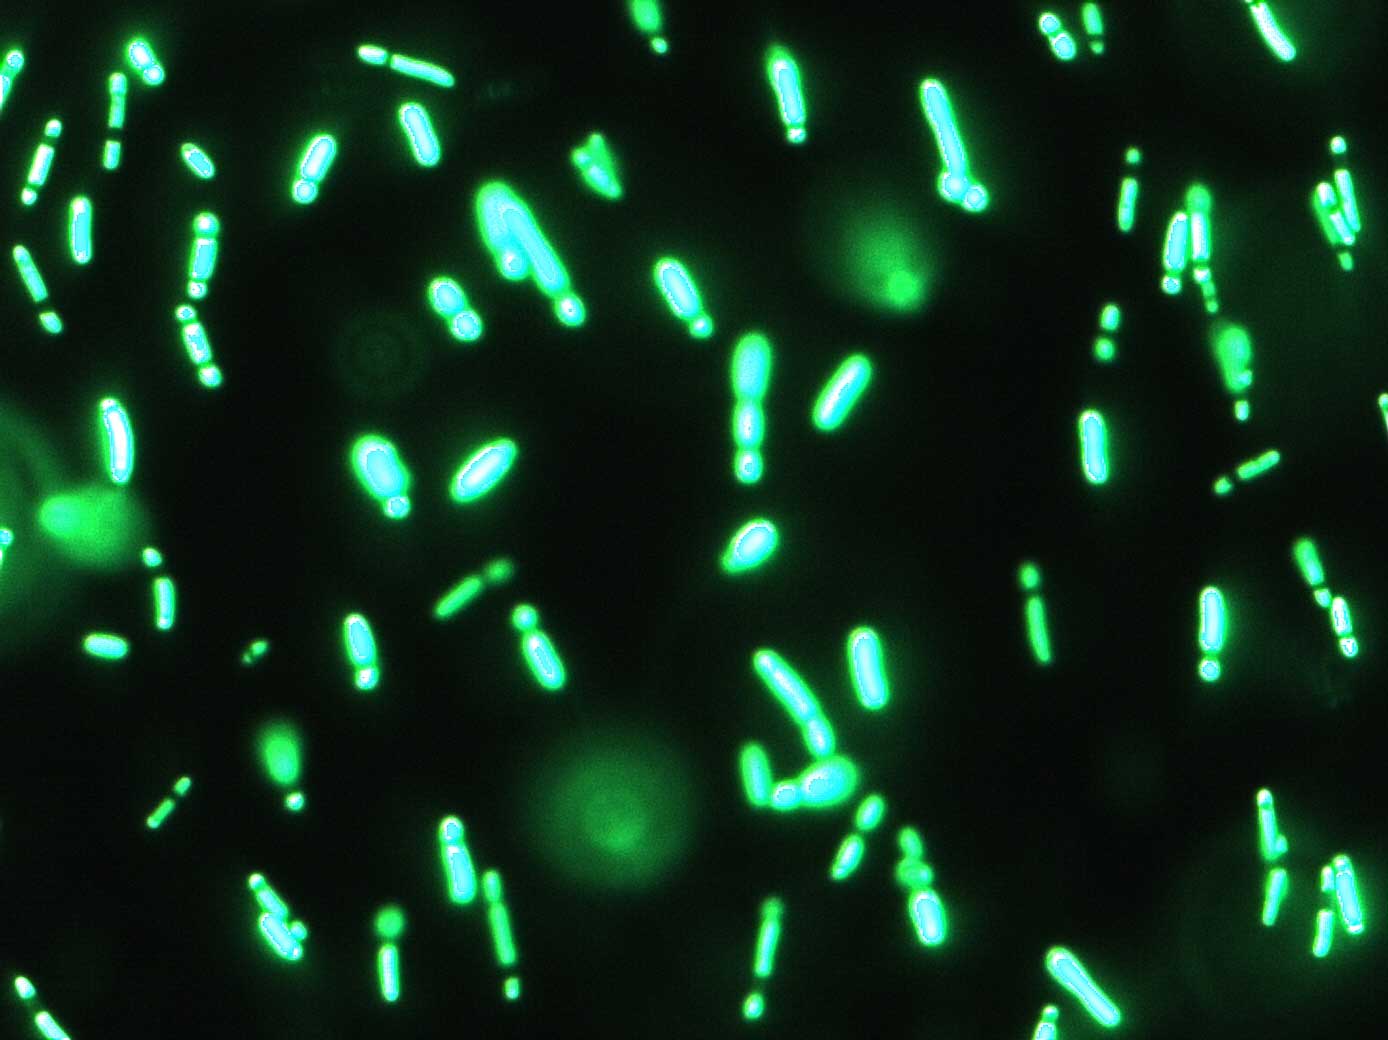
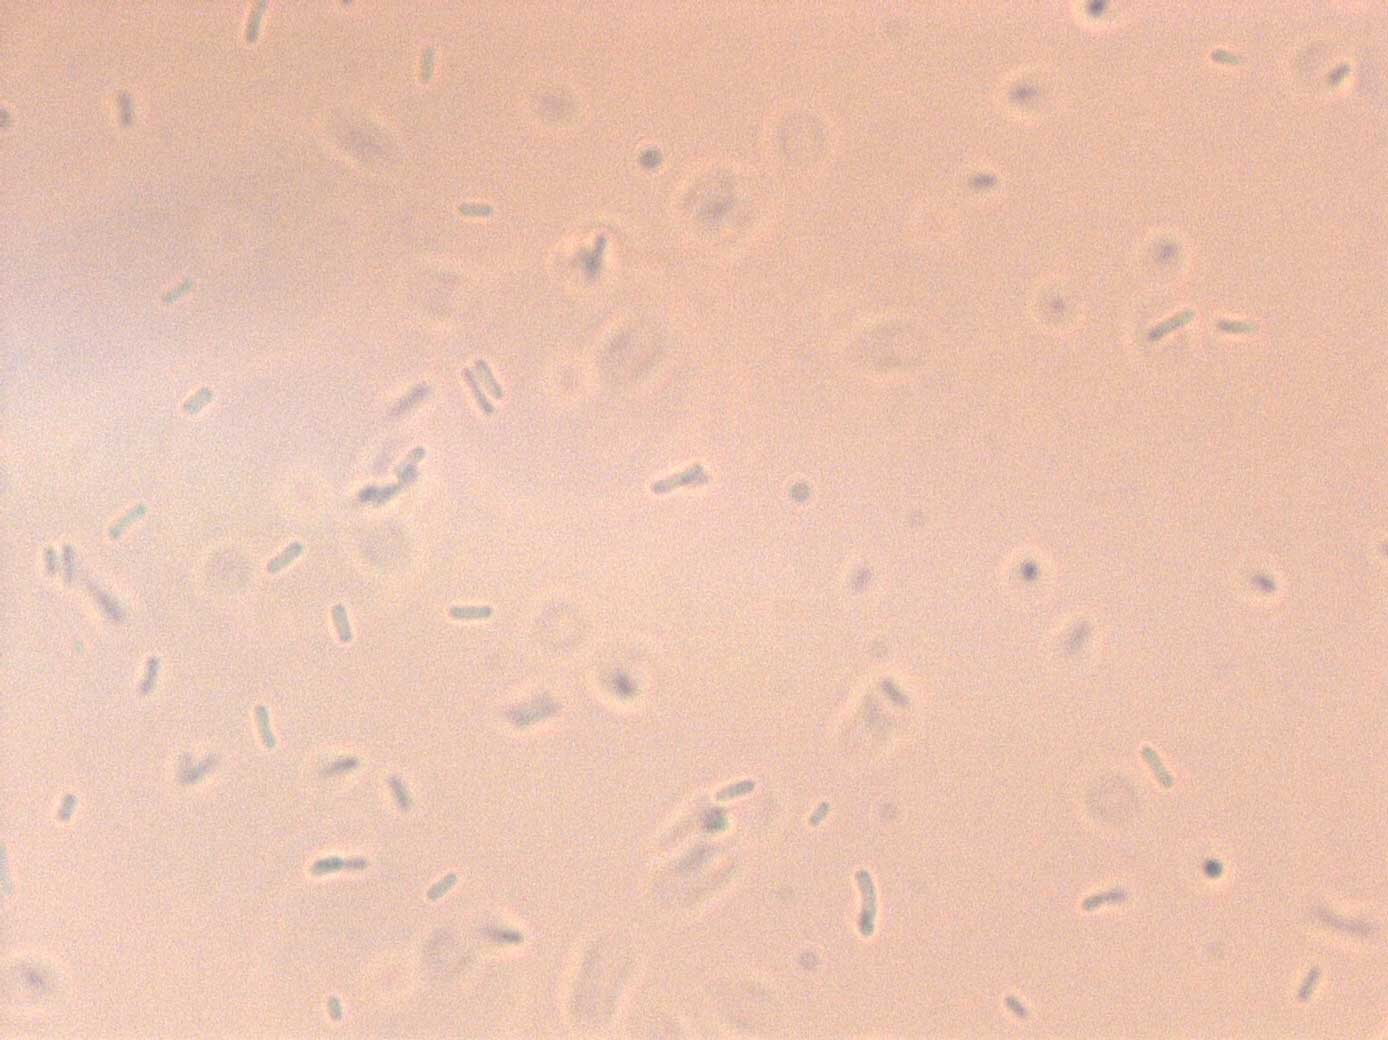
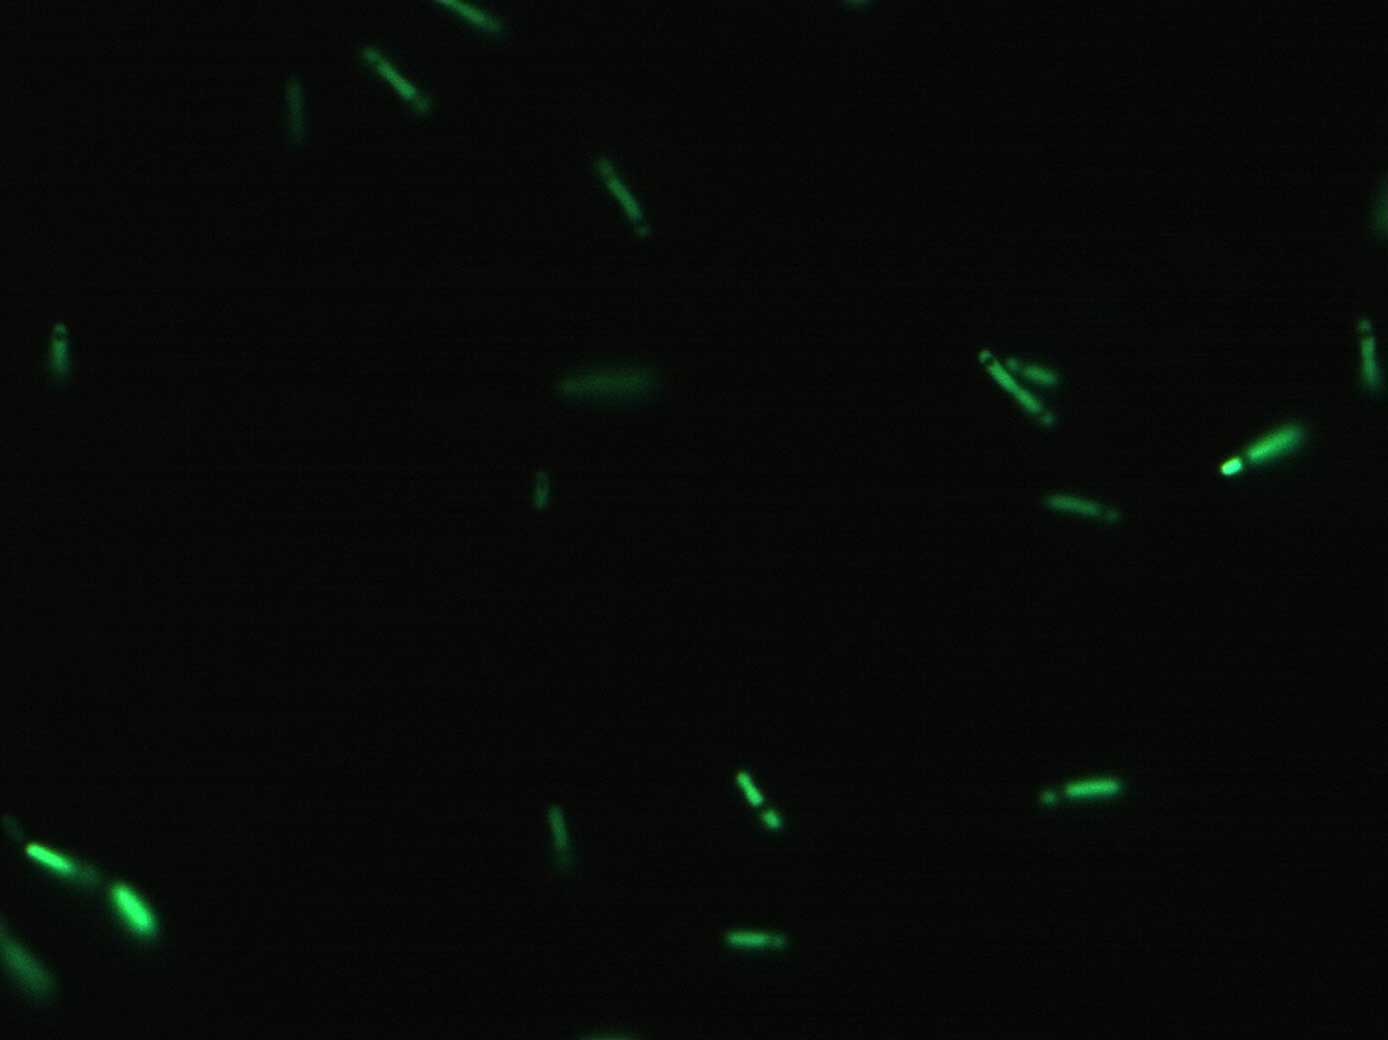
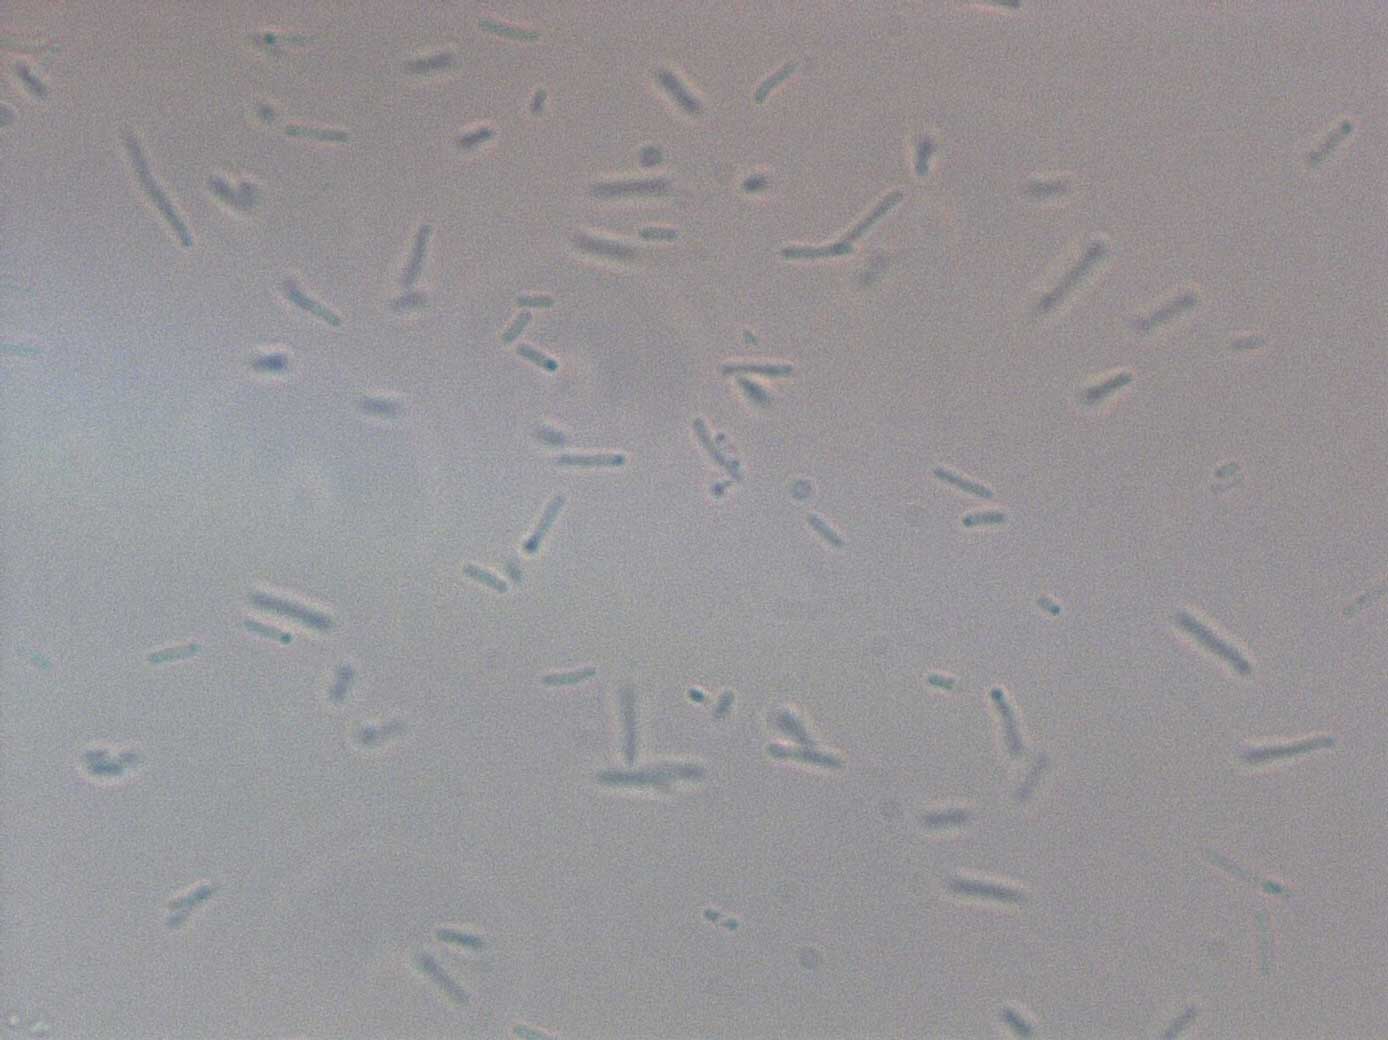
This preliminary experiment showed promising results, i.e. an approximate ratio of the two promoters of Pr(active) / Prm(basal) = 3 to 6
| Fluorescence | Visual | |
| Pr | ||
| Prm |
Discussion
This was only a quick and dirty measurement for testing the basic functionality. We will have to confirm these results with the more precise measurements. However, so far things look promising, since the difference between active Pr and basal Prm is a factor between 3 and 6.
Experiment 2005/10/25: FACS-01
Purpose
More precise measurement of basal activity of Pr and Prm and statistical properties of the population. Relative intensities. Basal activity (leakiness) and IPTG-induced activity of lac-input system and thus cI production.
Samples
Note: the promoters have been prepared at 37° C, the lac-systems at 25 ° C
- Pr ([http://parts2.mit.edu/r/parts/partsdb/view.cgi?part_id=189| R0051]) -> control
- Prm ([http://parts2.mit.edu/r/parts/partsdb/view.cgi?part_id=4799| I12007]) -> control
- Pr+GFP ([http://parts2.mit.edu/r/parts/partsdb/view.cgi?part_id=6125| S03335]) -> max. activity
- Prm+GFP ([http://parts2.mit.edu/r/parts/partsdb/view.cgi?part_id=6126| S03336]) -> basal activity (leakiness)
- Prm+RFP ([http://parts2.mit.edu/r/parts/partsdb/view.cgi?part_id=6127| S03337]) -> comparison (rel. intensity GFP vs. RFP)
- lac-system, 0.00 mM IPTG ([http://parts2.mit.edu/r/parts/partsdb/view.cgi?part_id=6133| J05505]) -> control @ no induction
- lac-system, 0.25 mM IPTG ([http://parts2.mit.edu/r/parts/partsdb/view.cgi?part_id=6133| J05505]) -> control @ intermediate induction
- lac-system, 2.50 mM IPTG ([http://parts2.mit.edu/r/parts/partsdb/view.cgi?part_id=6133| J05505]) -> control @ high induction
- lac-system+GFP, 0.00 mM IPTG ([http://parts2.mit.edu/r/parts/partsdb/view.cgi?part_id=6133| J05505]) -> leakiness @ no induction
- lac-system+GFP, 0.25 mM IPTG ([http://parts2.mit.edu/r/parts/partsdb/view.cgi?part_id=6133| J05505]) -> activity @ intermediate induction
- lac-system+GFP, 2.50 mM IPTG ([http://parts2.mit.edu/r/parts/partsdb/view.cgi?part_id=6133| J05505]) -> activity @ high induction
Expectations
The goal is to confirm the outcome of previous experiments, i.e. the Pr/Prm-ratio from FM01. Also, we want to put the intensity of GFP and RFP into relation for the same promoter (Prm). Finally we would like to estimate the leakiness of the two alternative lac-input systems (cI degradation does not matter at this point) - which is known to be leaky - at different levels of IPTG-induction.
Results
Unfortunately, we could not confirm the Pr/Prm intensity ratio of 3 to 6. The ratio measured in this experiment is around 1.6.
Discussion
The different Pr/Prm ratio clearly contradicts previous experiments with the spectrofluorometer. So either the samples have changed (e.g. accumulation of non-degrading fluorophores over time) or one of the measurements is invalid. In that case the analysis IPTG induced states does not make much sense. Thus we will first have to carry out more experiments to narrow this down.
Experiment 2005/10/27: FM-02
Purpose
Repetition: Quantify relative activity of Pr and Prm with the spectrofluorometer to confirm / falsify first measurement.
Samples
- Pr ([http://parts2.mit.edu/r/parts/partsdb/view.cgi?part_id=189| R0051]) -> control
- Prm ([http://parts2.mit.edu/r/parts/partsdb/view.cgi?part_id=4799| I12007]) -> control
- Pr+GFP ([http://parts2.mit.edu/r/parts/partsdb/view.cgi?part_id=6125| S03335]) -> full activity
- Prm+GFP ([http://parts2.mit.edu/r/parts/partsdb/view.cgi?part_id=6126| S03336]) -> basal activity (leakiness)
Expectations
We expected to confirm the results from either the first analysis with the spectrofluorometer or from the second measurment with the FACS. One pair should be consistent and will lead to further conclusions about the nature of this difference, i.e. whether we do not handle the instruments properly or whether it has to do with the samples (population age, fluorophore accumulation).
Results
After having adjusted the samples to OD600=1, we used the Pr-GFP sample to set the highest expected fluorescence at 501. Relative fluorescence of the Prm-GFP was 474, whereas for the two negative control samples it was 80. That results in a Pr/Prm activity ratio of 1.07.
Discussion
This difference is very low and contradicts earlier measurements, i.e. FM01. The difference in the two measurements could be due to a measurement error (the wrong sample was measured), but possibly it could be due to a saturation of GFP production in both systems. Since the plates are 2 weeks old, and since GFP is very stable, it can be supposed that after a while the concentration of GFP reaches a maximum level, independently of the promoter activity. Therefore new transformations should be performed with fresh cells and measurements should then be carried out with minimal delay.
Experiment 2005/10/28: FACS-02
Purpose
Repeat Pr/Prm comparison with samples prepared at 25° C to confirm / falsify results from FACS-01. Test relative activity when Pr and Prm are active in the same cell. Test whole EPD performance in ground state and IPTG-induced state. Not testing dynamics.
Samples
- Pr ([http://parts2.mit.edu/r/parts/partsdb/view.cgi?part_id=189| R0051]) -> control
- Pr+GFP ([http://parts2.mit.edu/r/parts/partsdb/view.cgi?part_id=6125| S03335]) -> max. activity
- Prm+GFP ([http://parts2.mit.edu/r/parts/partsdb/view.cgi?part_id=6126| S03336]) -> basal activity
- Pr+GFP+Prm+RFP ([http://parts2.mit.edu/r/parts/partsdb/view.cgi?part_id=6128| S03338]) -> individual cell comparison (intensity Pr+GFP vs. Prm+RFP)
- lac-system+Pr+GFP+Prm+RFP, 0.000 mM IPTG ([http://parts2.mit.edu/r/parts/partsdb/view.cgi?part_id=6131| J05503]) -> control @ no induction
- lac-system+Pr+GFP+Prm+RFP, 0.250 mM IPTG ([http://parts2.mit.edu/r/parts/partsdb/view.cgi?part_id=6131| J05503]) -> control @ intermediate induction
- lac-system+Pr+GFP+Prm+RFP, 2.500 mM IPTG ([http://parts2.mit.edu/r/parts/partsdb/view.cgi?part_id=6131| J05503]) -> activity @ high induction
- lac-system+Pr+GFP+Prm+RFP (cI+LVA), 0.000 mM IPTG ([http://parts2.mit.edu/r/parts/partsdb/view.cgi?part_id=6132| J05504]) -> control @ no induction
- lac-system+Pr+GFP+Prm+RFP (cI+LVA), 0.250 mM IPTG ([http://parts2.mit.edu/r/parts/partsdb/view.cgi?part_id=6132| J05504]) -> control @ intermediate induction
- lac-system+Pr+GFP+Prm+RFP (cI+LVA), 2.500 mM IPTG ([http://parts2.mit.edu/r/parts/partsdb/view.cgi?part_id=6132| J05504]) -> activity @ high induction
Expectations
Results
Something seems to be very wrong with the preparation of the cells and the results don't make too much sense. We will repeat all measurments with a fresh culture.
Discussion
Experiment 2005/10/31: FACS-03
Purpose
Time series to test activity at different induction levels. Test suitable IPTG range. Inverse case: cell preparation with IPTG present from transformation on (IPTG won't degrade).
Samples
Incubation over night: @ 37° C. Centrifugation: @ 225rpm. Volume: 3mL LB. Selection: Amp75/Km30. Note: we do not have a sample expressing maximum RFP intensity, so Prm+RFP was used as positive control to set the FACS.
- Pr ([http://parts2.mit.edu/r/parts/partsdb/view.cgi?part_id=189| R0051]) -> control
- Pr+GFP ([http://parts2.mit.edu/r/parts/partsdb/view.cgi?part_id=6125| S03335]) -> max. activity
- Prm+GFP ([http://parts2.mit.edu/r/parts/partsdb/view.cgi?part_id=6126| S03336]) -> basal activity
- Prm+RFP ([http://parts2.mit.edu/r/parts/partsdb/view.cgi?part_id=6127| S03337]) -> comparison (rel. intensity GFP vs. RFP)
Transformation without initial IPTG
- lac-system+GFP, 0.000 mM IPTG ([http://parts2.mit.edu/r/parts/partsdb/view.cgi?part_id=6133| J05505]) -> control @ no induction
- lac-system+GFP, 0.050 mM IPTG ([http://parts2.mit.edu/r/parts/partsdb/view.cgi?part_id=6133| J05505]) -> control @ intermediate induction
- lac-system+GFP, 0.250 mM IPTG ([http://parts2.mit.edu/r/parts/partsdb/view.cgi?part_id=6133| J05505]) -> control @ intermediate induction
- lac-system+GFP, 2.500 mM IPTG ([http://parts2.mit.edu/r/parts/partsdb/view.cgi?part_id=6133| J05505]) -> control @ high induction
Transformation with 0.250 mM IPTG, then transfer to different medium
- lac-system+GFP, transformation with 0.250 mM IPTG, then transferred to 0.000 mM IPTG ([http://parts2.mit.edu/r/parts/partsdb/view.cgi?part_id=6133| J05505])
- lac-system+GFP, transformation with 0.250 mM IPTG, maintained at 0.250 mM IPTG ([http://parts2.mit.edu/r/parts/partsdb/view.cgi?part_id=6133| J05505])
- Pr+GFP+Prm+RFP ([http://parts2.mit.edu/r/parts/partsdb/view.cgi?part_id=6128| S03338]) -> single cell comparison (intensity Pr+GFP vs. Prm+RFP)
- lac-system+Pr+GFP+Prm+RFP (cI+LVA), 0.000 mM IPTG ([http://parts2.mit.edu/r/parts/partsdb/view.cgi?part_id=6132| J05504]) -> control @ no induction
- lac-system+Pr+GFP+Prm+RFP (cI+LVA), 0.250 mM IPTG ([http://parts2.mit.edu/r/parts/partsdb/view.cgi?part_id=6132| J05504]) -> control @ intermediate induction
- lac-system+Pr+GFP+Prm+RFP (cI+LVA), 2.500 mM IPTG ([http://parts2.mit.edu/r/parts/partsdb/view.cgi?part_id=6132| J05504]) -> activity @ high induction
- lac-system+Pr+GFP+Prm+RFP, 0.000 mM IPTG ([http://parts2.mit.edu/r/parts/partsdb/view.cgi?part_id=6131| J05503]) -> control @ no induction
- lac-system+Pr+GFP+Prm+RFP, 0.250 mM IPTG ([http://parts2.mit.edu/r/parts/partsdb/view.cgi?part_id=6131| J05503]) -> control @ intermediate induction
- lac-system+Pr+GFP+Prm+RFP, 2.500 mM IPTG ([http://parts2.mit.edu/r/parts/partsdb/view.cgi?part_id=6131| J05503]) -> activity @ high induction
Expectations
- Pr in active state is stronger than Prm in basal state.
- For Pr+GFP+Prm+RFP the same values should be observed as for single components.
- RFP intensity is weaker than GFP intensity for same promoter in the FACS system (both naturally weaker, but also the system is not optimal to measure RFP emission).
- The lac-input system with initial induction of IPTG will show maximum activity of Plac (and thus cI) and stay at this level as long as the IPTG concentration is maintained, but will go back to basal activity if transferred to a medium without IPTG.
- Different induction levels of IPTG lead to different activity levels. Identify coarse range of minimal concentration leading to sufficient activity.
- For the whole systems, i.e. one with cI and one cI+LVA:
- a) The lac-input system is known to be leaky. Without induction, we expect high GFP intensity, but somewhat reduced compard to the single component system, because the Plac is leaky (as previous results have shown). For RFP we expect basal activity, however, somewhat increased for the same reason. Thus, the ratio between active Pr and basal Prm will be further reduced (i.e. < 2).
- b) By increasing the concentration of IPTG we expect to slowly invert this ratio, i.e. low or zero GFP activity and high RFP activity.
- For cultures that have been transformed under constant IPTG induction, we expect low or zero GFP activity and very high RFP activity, however, when transferred to a IPTG-free media the system should go back to ground state if the fluorophores either degrade or are sufficiently diluted during growth and cell devision.
- Also, we expect same intensities at the same level of induction for cultures that have always been induced and those that have later been induced (same final state), if the accumulation of non-degrading fluorophores is not too high or balanced out by dilution.
- It might be possible to observe a difference between systems with and without degradation tag for cI after changing to an IPTG-free medium.
Results
It seems that both the measurement itself as well as the interpretation of the results is no trivial matter and requires some experience. Here the results we think we can interprete at this point:
- Pr is stronger than Prm. Approximate quantitative result: activity of Prm relative to Pr is 57% (for this FACS measurement)
- GFP is much more intense on this system than RFP (for the same promoter). Approximate quantitative result: intensity of RFP relative to GFP is 15% (for this FACS measurement)
- TBD: Estimate of leakiness of lac-input system based on a comparison of the -0/+0 samples. set maximum activity as reference (001-j5+2500 - or higher in future experiments). put everything into relation to this reference.
- TBD: Degradation/dilution of GFP can be estimated based on a comparison of -0/-250 samples (for the whole system dilution might overcome the lack of degradation to some degree). compute relation of j5+0 and j5+250.
- Strangely, for Pr+GFP+Prm+RFP RFP expression seems to be weaker in the compound than when comparing single components.
- TBD: quantitative comparison.
- The whole systems behave strangely, since both activities seem to go down with increasing concentratoin of IPTG instead of lowering GFP activity and increasing RFP activity.
- However, for the system with cI+LVA we do see a decrease in GFP with higher induction.
- We cannot see any difference between cI and cI+LVA.
- For both systems we have high GFP activity in ground state (without induction), but also high RFP activity. TBD: try to quantify this
- When increasing the IPTG concentration we observe reduction of GFP activity for the cI+LVA system. Saturation seems to be already reached at 0.050 mM of IPTG - the smallest concentration tested so far. In this system RFP activity seems to remain constant. TBD: try to quantify. check number of cells.
Discussion
- Pr is clearly stronger than Prm. However, not so much and possibly not enough for the system to work. This could be due to the fact that Prm has a quite high basal activity. But there are other possible explanations to investigate:
- a) There might be a drain, i.e. an overlap of the spectra, so that part of the emission originating from GFP are assigned to RFP by the measurement system. This of course you try to rule out when calibrating the system with positive and negative controls (Also it is difficult to separate the emissions of the two fluorophores when one is much weaker than the other).
- b) Even weak promoters continue protein production during preparation. Since we are using a very stable fluorophore (RFP degrades over 20 years) it could accumulate in the time between preparation and actual measurement and the higher intensities might be due to higher concentrations of RFP. This should be verified by making a time series directly after preparation to see whether there is such an accumulation or saturation.
- c) [http://en.wikipedia.org/wiki/Fluorescence_resonance_energy_transfer| FRET]: E. coli are very small bacteria, i.e. in the range of 1μm. Thus, the concentrations of fluorophores might become very high and the fluorescence of RFP might be influenced by an energy transfer from GFP. Of course, this is just a possibility that we should rule out. This could be done preparing a cell extract: sonicating the population, thus destroying the cells and lowering the fluorophore concentration without losing the ratio. The resulting spectrum should show two distinct curves with true intensities.
Experiment 2005/10/31: LEICA-03
Purpose
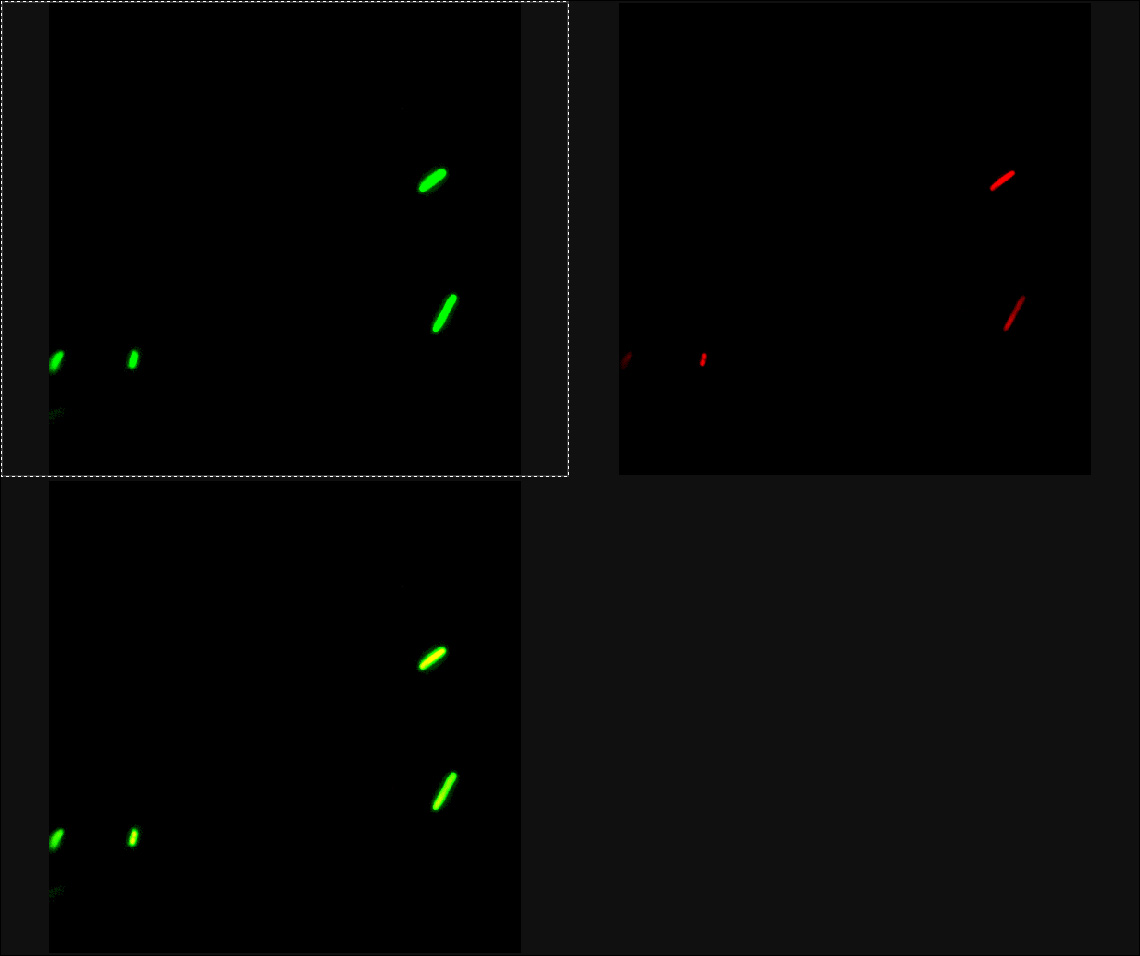
Observe single cells under the [http://www.lmc.ethz.ch/Instruments/Microscopes/Leica_SP2_AOBS| Leica SP2 AOBS], which is a [http://en.wikipedia.org/wiki/Confocal_microscopy| confocal laser scanning microscope]. Estimate/confirm relative activity of Pr+GFP+Prm+RFP subsystem and the two complete systems with and without degradation tag for cI. Compare different pre and post concentrations of IPTG.
Samples
E.coli fixed on Agarose between glass object holder and cover plate.
- Pr+GFP+Prm+RFP ([http://parts2.mit.edu/r/parts/partsdb/view.cgi?part_id=6128| S03338]) -> individual cell comparison (intensity Pr+GFP vs. Prm+RFP)
Transformation without IPTG present. IPTG added later:
- lac-system+Pr+GFP+Prm+RFP (cI), 0.000 mM IPTG-post ([http://parts2.mit.edu/r/parts/partsdb/view.cgi?part_id=6131| J05503]) -> control @ no induction
- lac-system+Pr+GFP+Prm+RFP (cI), 0.250 mM IPTG-post ([http://parts2.mit.edu/r/parts/partsdb/view.cgi?part_id=6131| J05503]) -> high post induction
Transformation with IPTG present. IPTG removed (change of substrate) or kept later:
- lac-system+Pr+GFP+Prm+RFP (cI), 0.250 mM IPTG-init, 0.00 mM IPTG-post ([http://parts2.mit.edu/r/parts/partsdb/view.cgi?part_id=6131| J05503]) -> initial reduction, back to ground state
- lac-system+Pr+GFP+Prm+RFP (cI), 0.250 mM IPTG-init, 0.25 mM IPTG-post ([http://parts2.mit.edu/r/parts/partsdb/view.cgi?part_id=6131| J05503]) -> induction maintained
Transformation without IPTG present. IPTG added later:
- lac-system+Pr+GFP+Prm+RFP (cI+LVA), 0.000 mM IPTG-post ([http://parts2.mit.edu/r/parts/partsdb/view.cgi?part_id=6132| J05504]) -> control @ no induction
- lac-system+Pr+GFP+Prm+RFP (cI+LVA), 0.250 mM IPTG-post ([http://parts2.mit.edu/r/parts/partsdb/view.cgi?part_id=6132| J05504]) -> high post induction
Transformation with IPTG present. IPTG removed (change of substrate) or kept later:
- lac-system+Pr+GFP+Prm+RFP (cI+LVA), 0.250 mM IPTG-init, 0.00 mM IPTG-post ([http://parts2.mit.edu/r/parts/partsdb/view.cgi?part_id=6132| J05504]) -> initial reduction, back to ground state
- lac-system+Pr+GFP+Prm+RFP (cI+LVA), 0.250 mM IPTG-init, 0.25 mM IPTG-post ([http://parts2.mit.edu/r/parts/partsdb/view.cgi?part_id=6132| J05504]) -> induction maintained
Expectations
Confirm Strong GFP signal (active Pr) and very weak RFP signal (basal Prm) with Pr+GFP+Prm+RFP subsystem (representing uninduced ground state). Check signal inversion for induced states of whole systems. Check consistency of pre and post induction for same end concentrations of IPTG. Possibly see difference between cI and cI+LVA.
Results
Strong GFP signal (Pr) for Pr+GFP+Prm+RFP subsystem ([http://parts2.mit.edu/r/parts/partsdb/view.cgi?part_id=6128| S03338]: representing uninduced ground state). Very weak RFP signal (Prm) of the system. We used the same gains and background for both fluorophores (detected with separate PMTs).
GFP excitation only with 488nm Argon laser possible. Very weak GFP signal above ~560nm. RFP excitation only with 561nm Solid state 2 and 594nm HeNe lasers possible. Dark gap between the two spectra around 565-585nm observable (however, keep in mind that RFP is very weak).
Unfortunately, we could not find any cells in the lac-system samples. No idea what went wrong.
Discussion
After learning how to prepare the samples properly (also for on-instrument induction if sensible) and how to handle the rather complex system ([http://www.lmc.ethz.ch/Instruments/Microscopes/Leica_SP2_AOBS| Leica SP2 AOBS]) properly in previous sessions, this measurement makes more sense. The Pr+GFP+Prm+RFP subsystem works as expected, i.e. strong Pr activity and basal Prm activity, even though RFP is the weaker fluorophore anyway.
Next steps: Repeat the experiment once we are sure that the basic system works and that we interprete our results correctly, try to get an idea of the dynamics of what we have right now by making time series. It is likely that we are measuring accumulated fluorophore concentrations (they do not degrade, but are only diluted). Thus we have to estimate the speed of saturation for the system, i.e. the GFP and RFP concentration vs. time. First with either the spectrofluorometer or with the FACS. Later, live induction of IPTG, hopefully increasing RFP intensity (current GFP does not degrade and will thus probably remain constant), might be observable on the LEICA.
Experiment 2005/11/02: FACS-04
Purpose
Use fresh cells and try to make time series to see production rates and accumulation/saturation. Test whether glucose can help to reduce the leakiness of the lac-system.
Samples
Expectations
Results
Discussion
Experiment 2005/11/02: LEICA-04
Purpose
Observe whole system under the microscope at different induction levels.
Samples
E.coli fixed on Agarose between glass object holder and cover plate.
Expectations
Results
Discussion
Back to ETH Zurich main page.
