EdinburghModellingsimple
From 2006.igem.org
| Line 152: | Line 152: | ||
0.01, which presumes strong binding. | 0.01, which presumes strong binding. | ||
| - | |||
| - | + | '''Species Initial Concentration (nMol/ml)''' | |
{|border=1 | {|border=1 | ||
| No. || Species || Initial Concentration (nMol) | | No. || Species || Initial Concentration (nMol) | ||
Latest revision as of 07:59, 30 October 2006
Contents |
Arsenic biosensor modelling: simple alternative formulation([http://2006.igem.org/Image:alternativemodelformulation.pdf PDF version])
Introduction
This report presents an alternative simplified model formulation for the arsenic (As(III))
biosensor system [1], in particular to explore relationships between binding activities of
arsR and arsD to their corresponding promoters and arsenate respectively. The report
structured as follows. First, short background to the biological system being modeled is
provided. Second, modeling assumptions and computational approaches are described. Finally,
results of model simulation are described.
Biological System
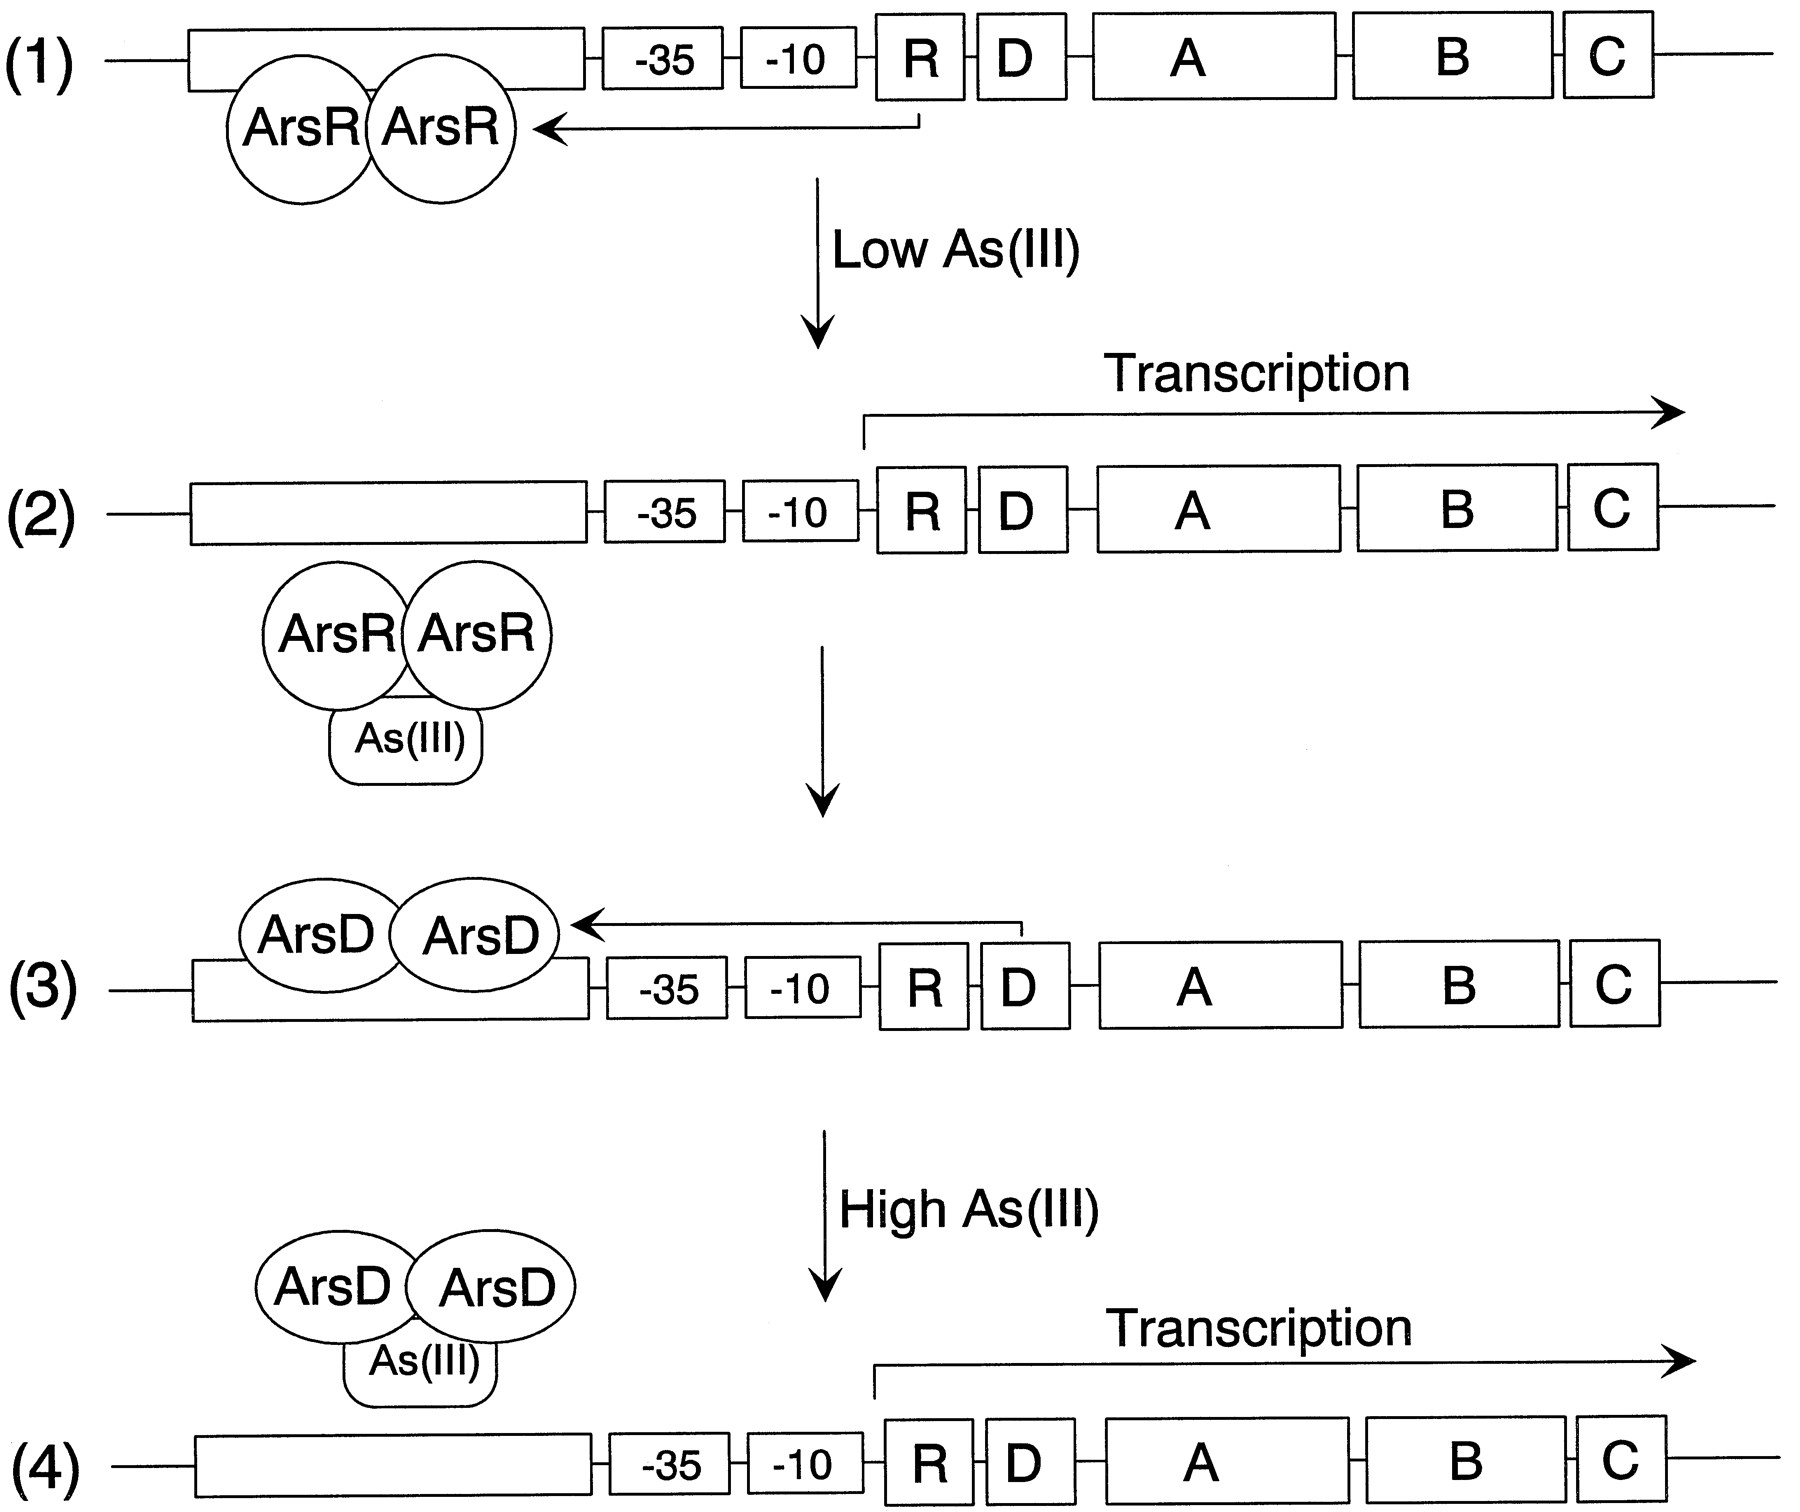
The model is a simplified representation of the arsenateal resistance (ars) operon of
resistance plasmids R773 and R46 that encodes a pump that produces resistance to arsenite
[2]. The operon has five genes, ArsR, -D, -A, -B, and -C. ArsR and ArsD are both
trans-acting repressor proteins that regulate the levels of ars transcript
ArsR is an As(III) -responsive repressor with high affinity for its operator site that
controls the basal level of expression of the operon . Binding of arsenate produces
dissociation of ArsR from the operator site, permitting transcription. As the levels of
transcript rise, synthesis of the integral membrane ArsB protein becomes toxic, limiting
growth. ArsD is a second regulator that controls the upper level of expression of the
operon, preventing overexpression of ArsB [3]. ArsD is also a homodimer of two 120-residue
subunits that binds to the same operator site as ArsR but with an affinity that is 2 orders
of magnitude less than that of ArsR [4]. Consequently, ArsD only binds to the ars operon
when produced in high concentrations, such as after prolonged stimulation of transcription
of the arsD gene following induction by arsenite or antimonite. Together, ArsR and ArsD
form a regulatory circuit that controls the basal and maximal levels of expression of the
ars operon.

Model
In the model we tried to harness the property of different binding affinities of ArsD and
ArsR to the arsenate and corresponding operator site to see how well they can account for
different responses of our pH based arsenate biosensor. As a recollection, in our model
urease is expressed from a hybrid promoter repressed by both lambda lCI repressor and LacI
repressor. In the presence of lactose, but absence of arsenate, urease is induced and leads
to rise in pH. When low amount of arsenate is present, an ArsR-repressed promoter is
induced, leading to expression of lambda lCI repressor, switching off urease production.
Thus the pH remains neutral. If higher amounts of arsenate are present, lacZ expression is
induced through an ArsD-responsive promoter, leading to a fall in pH. By using multiple
promoters in this way, a high sensitivity and high dynamic range are achieved.
We sought to address the question of interplay between different promoters and
transcription factors for arsenate with simpler model, which is truncated to only three
major types of equations and is provided below. The form of equations was adapted from [5].
All the modeling was done using COPASI software.
Where ARS – arsenic concentration, Kars-d and Kars-r – affinity of ArsD and ArsR to
arsenic, ARSRt and ARSDt – total amount of ArsR and ArsD, Karsd and Karsr– affinity
(Dissociation constant) of ArsD and ArsR to their corresponding promoters, Klacz and Klci –
degradation constants for LacZ and lCI respectively, Blacz and Blci – maximal expression
value of corresponding transcription factors. Burease and Kurease are maximal expression
and degradation constant for Urease, and Klci – lCI affinity (Dissociation constant) for
urease (inhibitory effect of LacI is absorbed into Burease).
The model uses µm units for arsenate. The following conversion table - 1 to 10,000 ppb
equal approximately 0.01 to 100 µm - taken from (Whole-Cell Bacterial Biosensors and the
Detection of Bio available Arsenic [1]) was used in the modeling.
The model was built using followings assumption and kinetic parameters:
- Since every model is only an approximation of the real systems behavior, it is
limited in its predictive ability to the questions it is addressed to answer. In current
model we make an assumption that arsD and arsR bind non-overlapping regions of the operator
and there is no “combinatorial effect” between to different transcription factors and sites
they bind. Based on this assumption we consider a set of parameters that can model response
to different levels of arsenic.
- Transcription and translation reactions are combined, there fore promoter activity
increases much faster (20 min) than if translation and transcription were separate
processes.
- Dissociation constant of arsenic (Karsd and Karsr) for arsR is 0.03 and for arsD – 10 (~
100
fold difference).
- LacI is presumed to be in saturation; therefore mass action kinetics is applied.
- It is also presumed that Dissociation constant of LCI for urease promoter is low –
0.01, which presumes strong binding.
Species Initial Concentration (nMol/ml)
| No. | Species | Initial Concentration (nMol) |
| 1 | arsD total | 0.1 |
| 2 | arsR total | 0.1 |
| 3 | LacZ | 0.0001 |
| 4 | LCI | 0.0001 |
| 5 | Urease | 0.001 |
| 6 | Arsenic | VARIED |
| 7 | LacI | 0.0001 |
Results
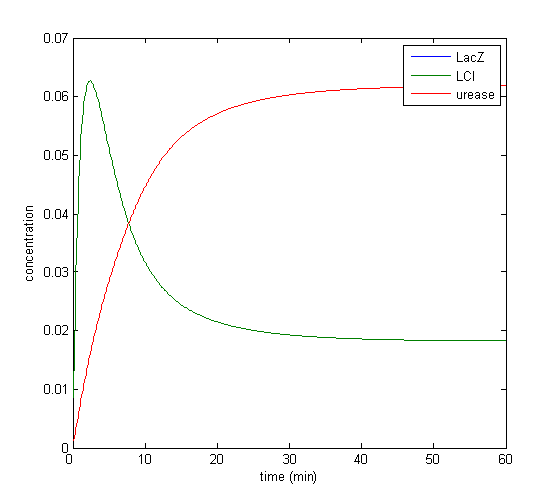
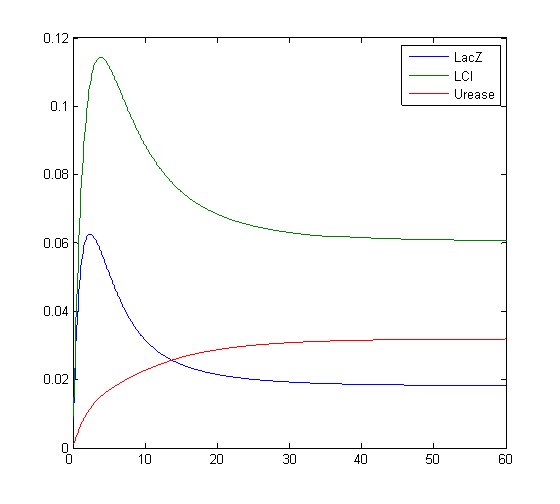
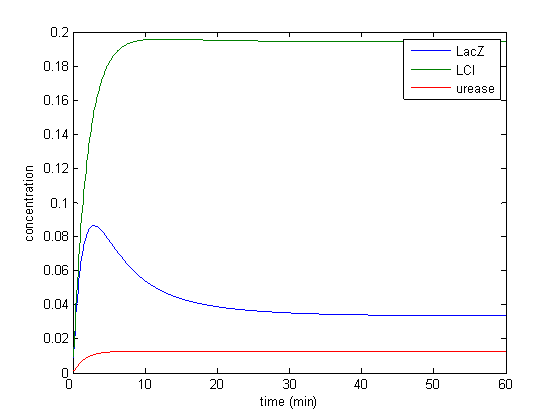
Model response to arsenic
Here we present results of simulation which agrees with the other model formulation and
biological system of arsenic biosensor.
References
1. Strosnider, H. (2003) Whole-Cell Bacterial Biosensors and the Detection of Bioavailable
Arsenic in, Office of Solid Waste and Emergency Response, U.S. Environmental Protection
Agency,
2. Barry, P. R. (1996) Bacterial resistance to heavy metals and metalloids, Journal of
Biological Inorganic Chemistry. V1, 273-277.
3. Chen, Y. & Rosen, B. P. (1997) Metalloregulatory Properties of the ArsD Repressor, J.
Biol. Chem. 272, 14257-14262.
4. Li, S., Rosen, B. P., Borges-Walmsley, M. I. & Walmsley, A. R. (2002) Evidence for
Cooperativity between the Four Binding Sites of Dimeric ArsD, an As(III)-responsive
Transcriptional Regulator, J. Biol. Chem. 277, 25992-26002.
5. Mangan, S. & Alon, U. (2003) Structure and function of the feed-forward loop network
motif, PNAS. 100, 11980-11985.


