EdinburghModeling
From 2006.igem.org
Contents |
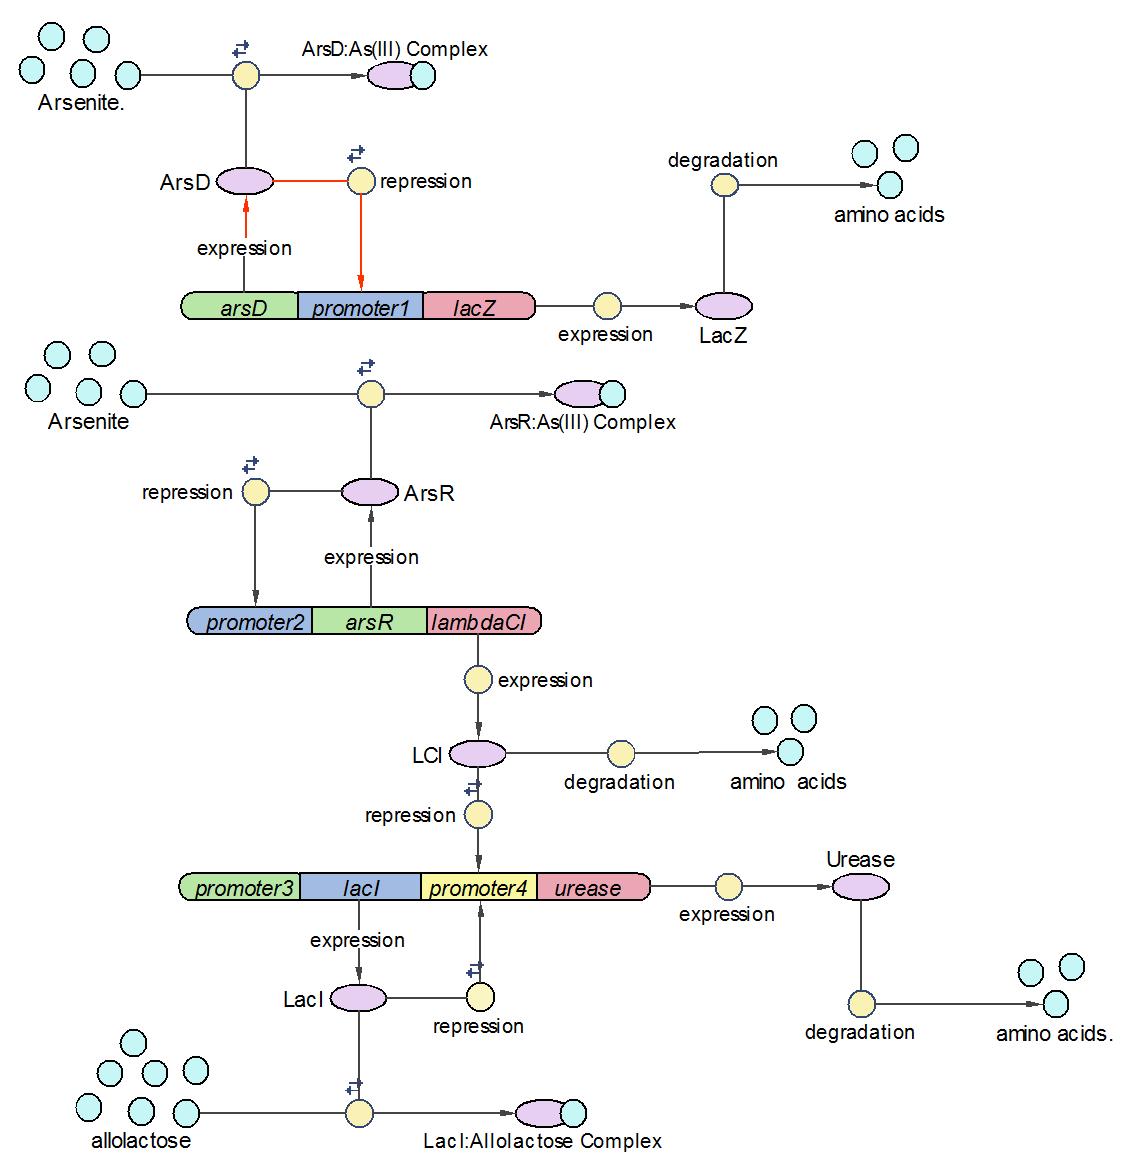
System Diagram of Arsenic Biosensor
Reaction set
| No. | Name | Equation | Rate Law | Parameters |
| 1 | ArsD binding to Arsenic (III) | ArsD+2As(III)=ArsD-2As(III) | Mass Action | K1=1000 K-1=0.65 |
| 2 | ArsD binding to promoter1 | 2 ArsD+promoter1=2ArsD-promoter1 | Mass Action | K2=10000, K-2=0.65 |
| 3 | ArsD degradation | ArsD->null | Mass Action | K3=0.05 |
| 4 | ArsD production | promoter1->promoter1+ArsD | Michaelis-Menten | V4m=0.5, K4m=75 |
| 5 | ArsR binding to Arsenic (III) | ArsR+2As(III)=ArsR-2As(III) | Mass Action | K5=1000, K-5=0.65 |
| 6 | ArsR binding to promoter2 | 2ArsR+promoter2=2ArsR-promoter2 | Mass Action | K6=10000, K-6=0.65 |
| 7 | ArsR degradation | ArsR->null | Mass Action | K7=0.05 |
| 8 | ArsR production | promoter2->promoter2+ArsR | Michaelis-Menten | V8m=10, K8m=25 |
| 9 | LacI binding to allolactose | LacI+allolactose=LacI-allolactose | Mass Action | K9=10000, K-9=0.1 |
| 10 | LacI binding to promoter4 | LacI+promoter4 = LacI-promoter4 | Mass Action | K10=1000, K-10=0.5 |
| 11 | LacI degradation | LacI->null | Mass Action | K11=0.1 |
| 12 | LacI production | promoter3->promoter3+LacI | Michaelis-Menten | V12m=0.5, K12m=40 |
| 13 | lacZ degradation | lacZ->null | Mass Action | K13=0.1 |
| 14 | lacZ production | promoter1->promoter1+lacZ | Michaelis-Menten | V14m=25, K14m=10 |
| 15 | LCI binding to promoter 4 | LCI+promoter4=LCI-promoter4 | Mass Action | K15=10000, K-15=0.5 |
| 16 | LCI degradation | LCI->null | Mass Action | K16=0.1 |
| 17 | LCI production | promoter2->promoter2+LCI | Michaelis-Menten | V17m=10, K17m=25 |
| 18 | Urease degradation | Urease->null | Mass Action | K18=0.1 |
| 19 | Urease production | promoter4->promoter4+Urease | Michaelis-Menten | V19m=10, K19m=40 |
Note: The units for first, second and third order rate constants are expressed in units of second^-1, nMol^-1*second^-1 and nMol^-2*second^-1 respectively.
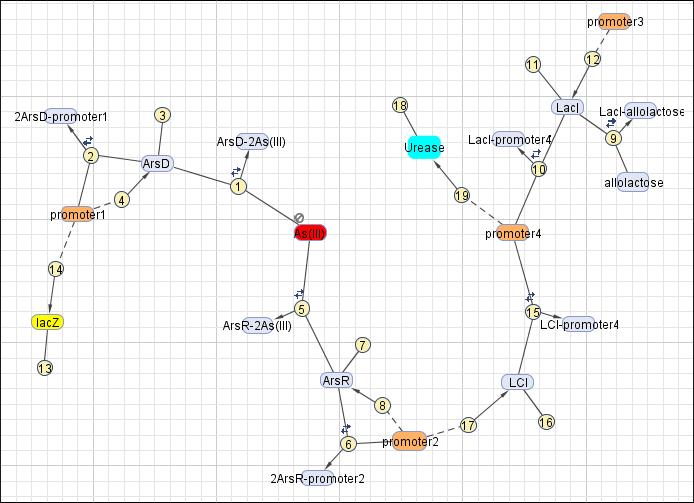
This reaction map is generated from the reaction set above using Simbiology Toolbox.
Initial concentration
| No. | Species | Intial Concentration (nMol) |
| 1 | ArsD | 25 |
| 2 | As(III) | 40 |
| 3 | 2ArsD-promoter1 | 25 |
| 4 | promoter1 | 5 |
| 5 | ArsR | 25 |
| 6 | 2ArsR-promoter2 | 25 |
| 7 | promoter2 | 5 |
| 8 | LCI | 4 |
| 9 | LacI | 0.1 |
| 10 | LacI-allolactose | 0.1 |
| 11 | allolactose | 1000 |
| 12 | LacI-promoter4 | 0.1 |
| 13 | promoter4 | 25 |
| 14 | LCI-promoter4 | 0.1 |
| 15 | Urease | 0.1 |
| 16 | promoter3 | 5 |
| 17 | Other species | 0 |
Methodology
Results
System response
Parameter sensitivity analysis
The most sensitive parameters affecting lacZ
| Nanme | Description | Peak value of sensitivity | Normal value |
| K-1 | ArsD-2AS(III) dissociate rate | -2 | 0.65/s |
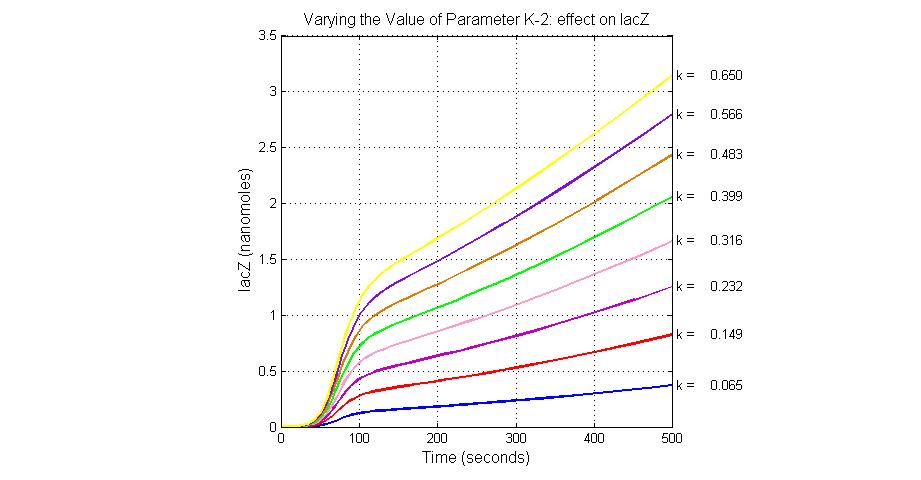
| K-2 | 2ArsD-promoter1 dissociate rate | 4 | 0.65/s |
| K3 | ArsD degradation rate | 90 | 0.05/s |
| K7 | ArsR degradation rate | 12 | 0.05/s |
| K13 | LacZ degradation rate | -35 | 0.1/s |
The most sensitive parameters affecting Urease
| Nanme | Description | Peak value of sensitivity | Normal value |
| k3 | ArsD degradation rate | -30 | 0.05/s |
| k-6 | 2ArsR-promoter2 dissociate rate | -5 | 0.65/s |
| k7 | ArsR degradation rate | -120 | 0.05/s |
| K18 | Urease degradation rate | -350 | 0.1/s |
| V19m | Urease production maxium rate | 3.5 | 10 nMol/s |
Species sensitivity analysis
The most sensitive species affecting lacZ
| Name | Initial concentration (nMol) |
| promoter1 | 5.0 |
| promoter2 | 5.0 |
| ArsD-2As(III) | 0 |
| ArsD | 25 |
| ArsR | 25 |
The most sensitive species affecting Urease
| Name | Initial concentration (nMol) |
| LCI | 4 |
| LacI-promoter4 | 0.1 |
| promoter4 | 25 |
| promoter2 | 5 |
| promoter1 | 5 |


