X-Y chemotaxis
From 2006.igem.org
Contents |
Group I
Experiment
Aim
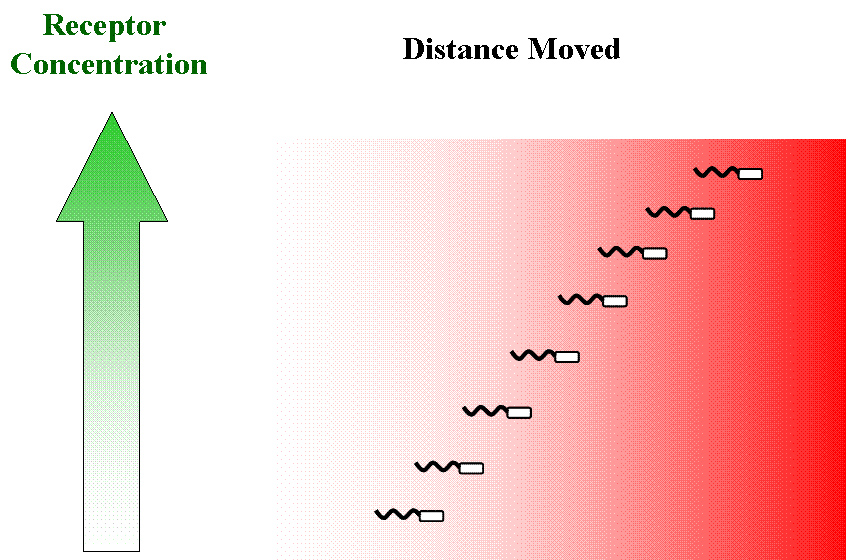
Our aim is to get complete two dimensional control over the movement of colonies of E. coli. on a solid substrate such as an agar plate. We plan to acheive this by hacking into the existing chemotactic machinery in the E. coli cell. Specifically, if we are able to independently and efficiently alter the sensitivity of our bugs to stable orthogonal gradients of different amino acids, it will be possible to implement such control.
Approach
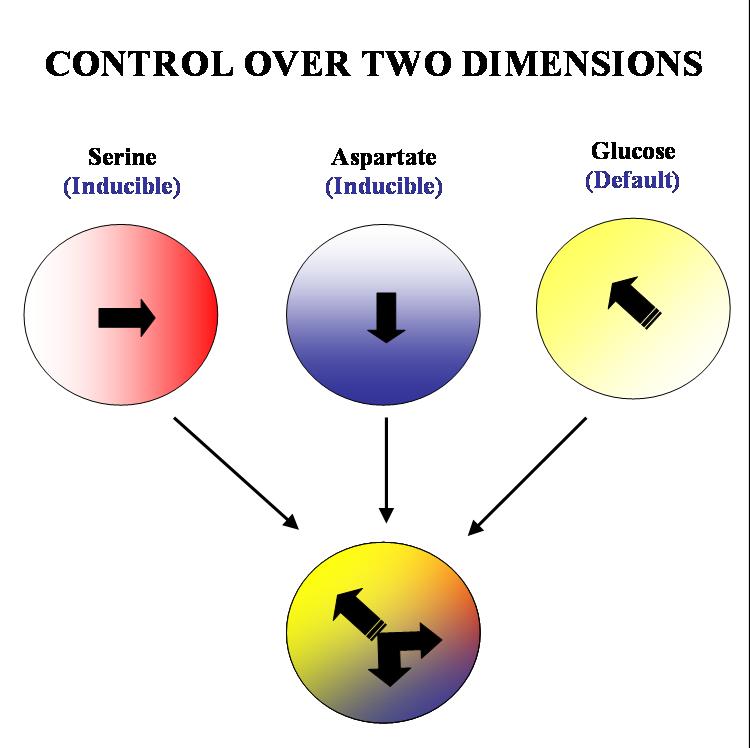
The specific geometry we have in mind is the following: there will be two stable gradients of serine and aspartate, orthogonal to each other. By inducing the expression of Tar and Tsr chemotaxis receptors (Tar for aspartate and Tsr for serine) in a null background (UU1250 strain) we hope to independently alter the response of the bug to these two gradients. There will also be a third gradient of glucose angled at 135 degrees to each of the amino acid gradients. Glucose is a PTS (phosphotransferase system) sugar and doesn't require Tar/Tsr receptor expression for its detection. Hence the bug will be constitutively responsive to glucose and this will serve as the default negative direction.
Constructs
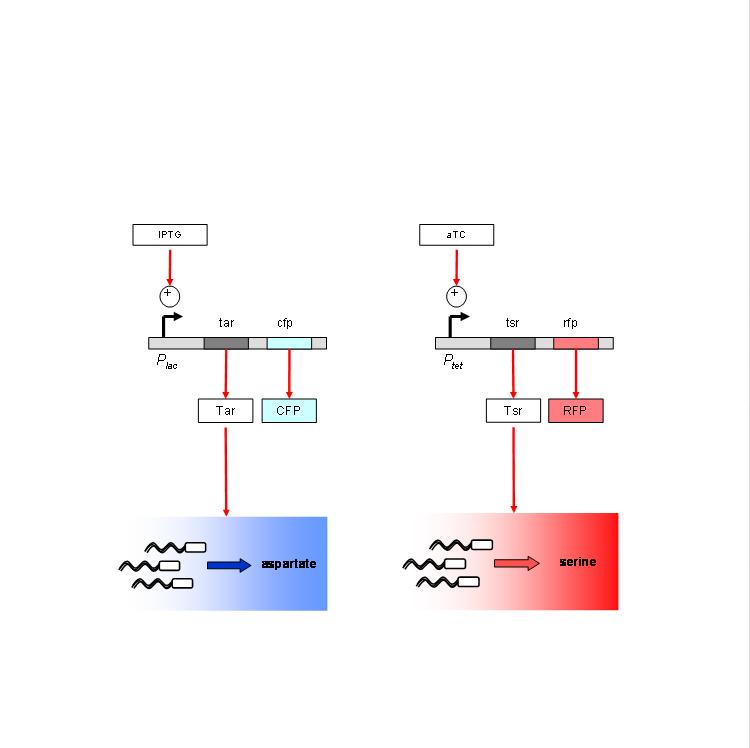
We are using the following constructs for induction of expression of Tar and Tsr. Tar expression is controlled by the lactose promoter, while Tsr expression is controlled by the Tet promoter. CFP and RFP provide readouts of relative transcript levels. We specifically chose these two reporters because of their spectral spacing in order to minimize bleed-through during fluorescence imaging.
The chemotaxis null strain, UU1250, first had to be transduced with chromosomal copies of the genes coding for repressor molecules for each of the promoters - lacI for the lac promoter, and TetR for the Tet promoter. This was done using P1 phage transduction with the donor strain K12Z1. The selection marker was Spectinomycin. We selected 4 strains of the (lacI-TetR) transduced UU1250, named UU1250Z1 4 through 7, and went ahead to test independent induction.
[http://partsregistry.org/cgi/partsdb/pgroup.cgi?pgroup=iGEM2006partsregistry.org/cgi/partsdb/pgroup.cgi?pgroup=iGEM2006&group=Bangalor See our parts]
Induction
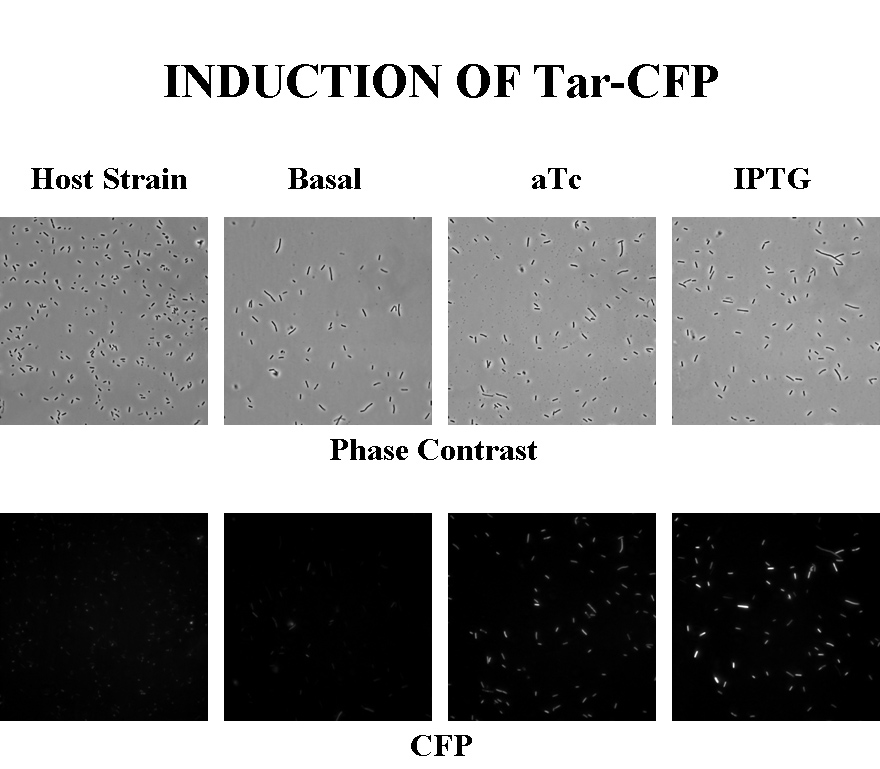
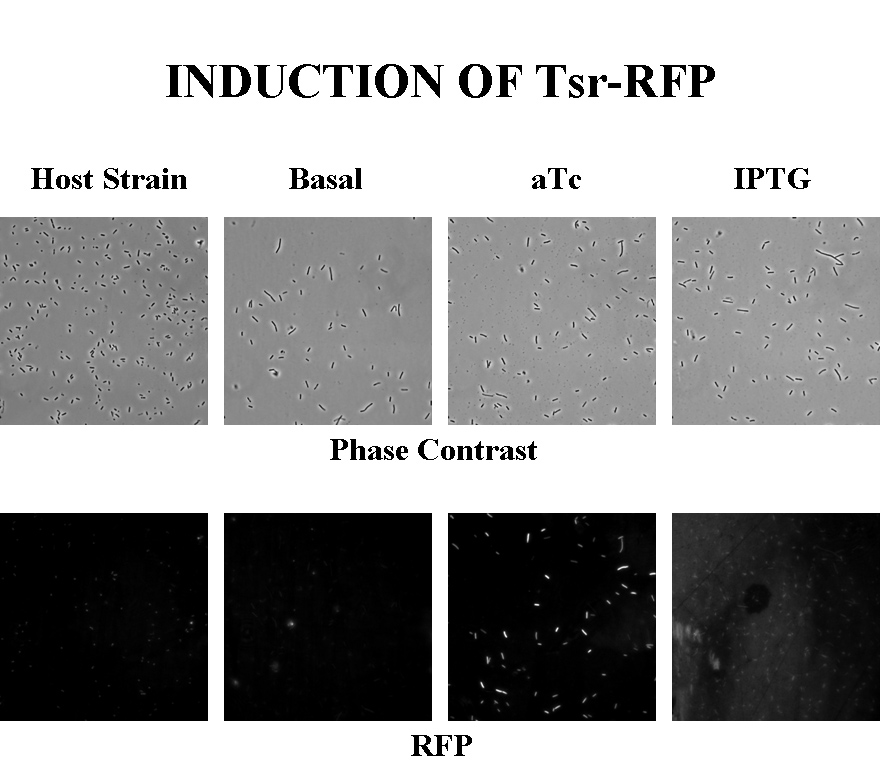
Briefly, UU1250Z1, transformed with a plasmid containing both the Tar and Tsr constructs, was grown in LB broth + antibiotic overnight and then in succinate M9 minimal medium for a period of around 5 hours, with either IPTG or ATC (inducers for the lac and Tet operons respectively). A negative control to measure basal expression in absence of any inducer was included, while untransformed UU1250Z1 served as another negative control for autofluorescence levels.
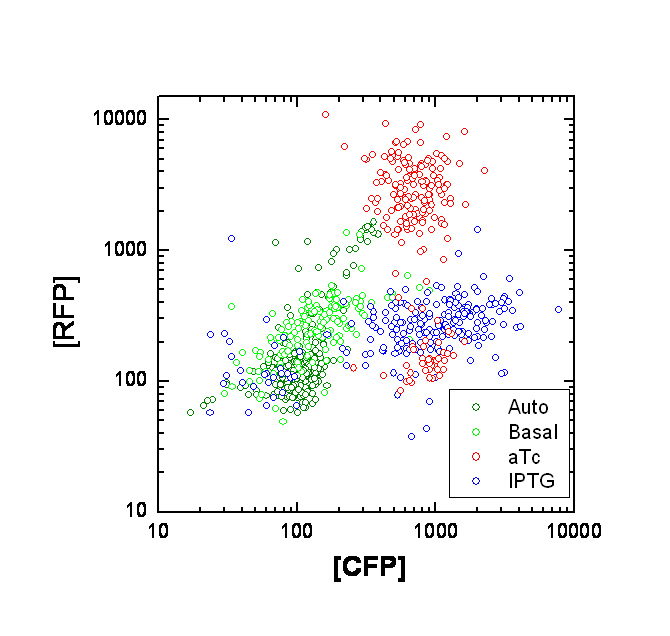
Each point on the scatter plot to the right indicates the total CFP v/s RFP fluorescence of a single E. coli cell, after correction for bleed-through and background subtraction. It is apparent that there is significant cross induction when ATc is added, since an increase in the CFP fluorescence also occurs.
A few explanations for the above anomaly :
If the Tsr-RFP construct was upstream of the Tar-CFP construct, it could be the case that the increase in CFP could be due to low efficiency of transcriptional termination, which would result in a long transcript containing both constructs. However this possibility is ruled out because the Tar-CFP construct is upstream in our case.
Alternately, this could be due to incorrect bleed-through correction. We need to confirm this with cells expressing CFP or RFP alone. A straightforward approach is to transform cells with only one of the constructs at a time.
We will also transform UU1250 (i.e. the original null strain without lacI and TetR repressors) with the constructs, to determine maximal expression levels, and to see where our induction stands on this scale.
Ruchi has done the next round of induction experiments. Results will be uploaded soon...
Chemotaxis Assays and Gradient Setup
To correlate the induction results to functionality of the chemotaxis system, a good assay to test chemotactic ability to various attractants is needed. We have tried various microscopic as well as macroscopic (plate) assays. I will outline them below...
- Swarm Plate
The rationale behind using the swarm plate was that one sees multiple rings (in Tryptone swarm plates) corresponding to E. coli swarming to different amino acids - for e.g. the outermost ring is due to serine chemotaxis, while the next ring is due to aspartate chemotaxis. If we were to induce expression of Tar or Tsr separately, we should see prescence or absence of the corresponding rings. This would also help resolve the problem of cross-induction we were having. We have been attempting swarm plates for many months now, but for some unknown reason, we still haven't got it to work. The positive control has been E. coli K12 in all cases, while the negative control has been UU1250. The various combinations we have attempted are...
- LB Swarm - Using 0.25% LB Agar
- M9 Swarm - Using 1% succinate M9 minimal medium with various concentrations of serine (uM - mM) added + 0.25% Agar
- Tryptone Swarm - Using 1% Tryptone + 0.25% Agar
Inoculation has been carried out in various ways...
- Stabbing the center of the plate and ejecting 2-5ul of culture
- Ejecting 2-5 ul on the surface of the solid medium
- Dipping sterile filter paper discs in culture and then placing in the center of the swarm plate.
- Motility
One issue that came up was that perhaps the bacteria weren't motile, i.e. they hadn't synthesized flagellae or some other requirement for motility. Our growth conditions were ususally overnight growth in LB or 1% Tryptone broth in a shaker at 37 degrees. When we examined these bugs under the microscope, indeed we saw that they were more or less sitting still. So now the focus was on getting them to be motile in an efficient and reproducible manner. Here again, we tried various methods...
- Growing them in lowered concentrations of the carbon source. This was courtesy of Jim Brown at Cambridge. We grew them in increasingly lowered concentrations of glycerol M9 medium (1%, 0.1%, 0.01% and even 0%) serially at 37 degrees. However, the bugs were still non-motile.
- Another idea was to not grow them in a shaker, but under standing conditions. The rationale here was that we would be selecting for the bugs that were motile, assuming that the non-motile population would die off due to their inability to reach fresh nurients or get away from their waste products. This was again tried out at 37 degrees, but didn't meet with any success.
- Finally, around mid September, we tried a protocol from [http://www.sciencemag.org/cgi/content/full/292/5524/2080 this paper] where the two main differences in their protocol were the inclusion of 0.1% casamino acids in the minimal medium and growth at 31 degrees C. This attempt was successful - we could see hundreds of motile cells under the microscope (phase contrast). A couple of experiments were then carried out to check whether it was the lowered temperature or the casamino acids that had induced motility. It was seen that after growth at 30 degrees C, most bacteria were motile, even in the absence of the amino acids, while at 37 degrees, we never saw any motility. We concluded from this that temperature is the main factor controlling the onset of motility, while casamino acids seem to increase the effect, but are not strictly neccessary. The adapted protocol is as follows...Inoculate the strain from a single colony into Tryptone broth (1% Tryptone, 0.5% NaCl) containing 25ug/ml antibiotic and grow for 16 hours at 37 degrees in a shaker. From this transfer culture at 1 in 60 dilution into 2 ml of M9 minimal medium (in a 50 ml falcon tube) containing 0.4% glycerol + 0.1 mM CaCl2 + 2 mM MgSO4 + antibiotic and grow for 10 hours at 30 degrees C. The bugs will then be motile.
- We had another go at the swarm plate using the above protocol for motility induction. However, despite several trials, the swarm plate (both glycerol M9 agar and tryptone agar) still didn't work. We're still not sure what we're missing.
- Slant Plate
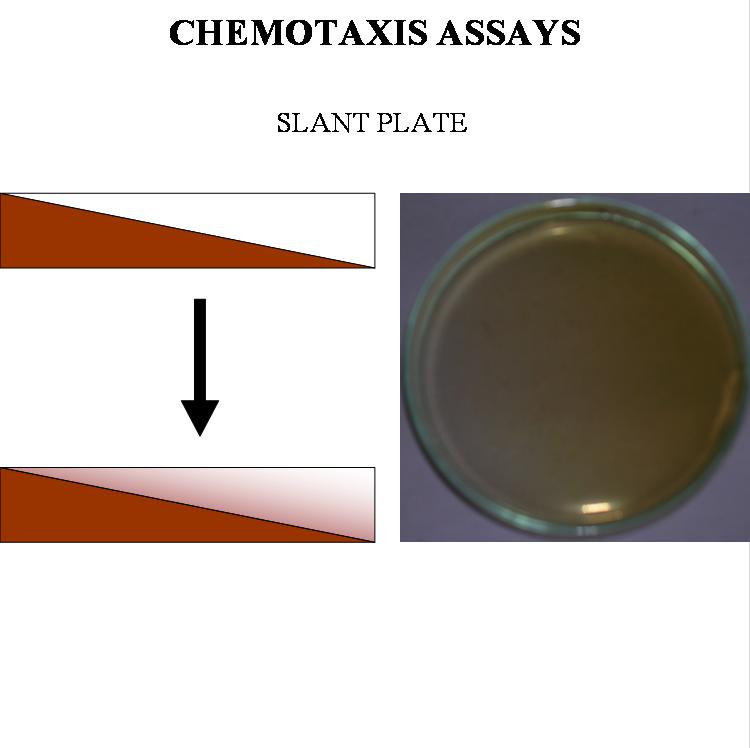
This was an attempt to establish a stable (within the time course of the experiment) gradient(s) in a solid substrate. Briefly, a layer of hard agar, containing the chemoattractant is layered at an angle at the bottom of the plate. After solidification, a layer of soft agar is then poured over the slant to give a horizontal surface. The gradient is set up by diffusion from the lower layer to the upper layer. A KMnO4 gradient set-up is shown here:
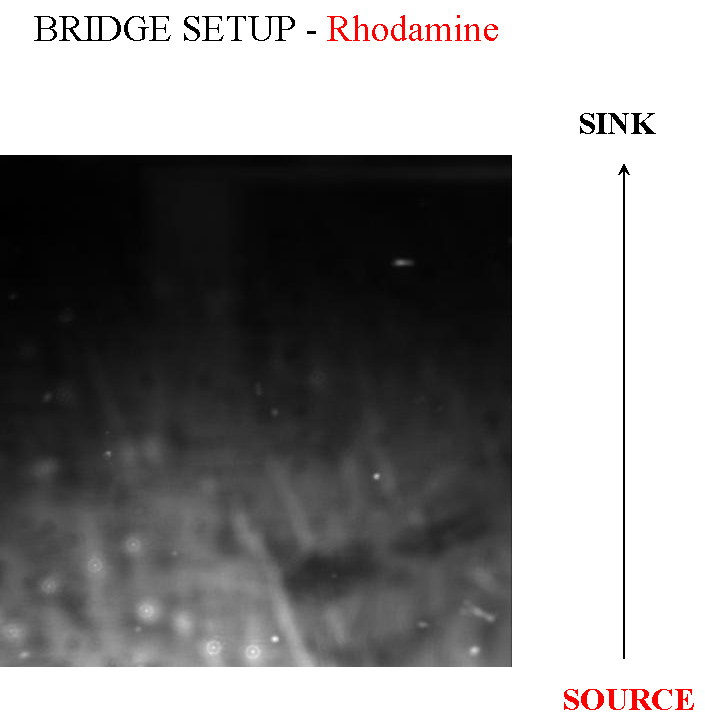
- Bridge Setup (Microscopic)
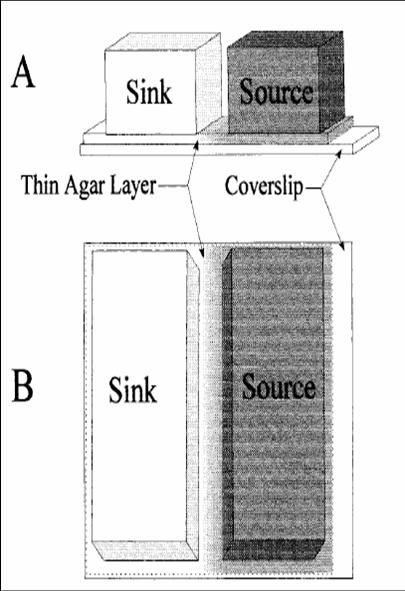
This is a method we picked up from [http://jb.asm.org/cgi/reprint/178/12/3480 this paper], where the authors managed to create a gradient in an imaging setup which was stable for a long period of time. Here, a layer of soft agar is overlayed on a slide, upon which are placed two blocks of hard agar, one of which is the source and contains chemoattractant, while the other serves as a sink. A gradient is setup in the soft agar bridging the two blocks, and since the volume of the blocks is much larger than that of the bridge, the gradient is purpoted to be stable for long periods of time. The bacteria are incoluated in the center of the bridge. The power of this method is that by placing the source and sink blocks in various geometries, one can setup multiple gradients at a time.
- Plug Assay (Microscopic)
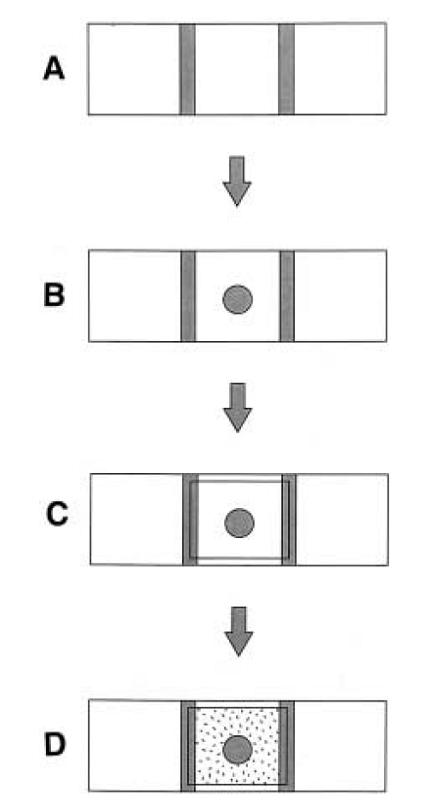
Reshma Shetty directed us to [http://www.sciencedirect.com/science?_ob=ArticleURL&_udi=B6T2W-3RD1SSV-1X&_coverDate=11%2F15%2F1997&_alid=477118798&_rdoc=1&_fmt=&_orig=search&_qd=1&_cdi=4929&_sort=d&view=c&_acct=C000062482&_version=1&_urlVersion=0&_userid=4178516&md5=972ea29ff3acf4c0281275e4f5035cac this assay] which had been successfully adapted for E. coli by James Brown at Cambridge. Here, a molten blob of 1% agar containing the chemoattractant
is placed in the center of a slide between two spacers (we used insulation tape) and a coverslip immediately placed over it, so that it solidifies into a plug. Next, medium containing bacteria is filled into the rest of the space between the slide and coverslip by capillary action. The edge of the agar plug is imaged to check for accumulation of bacteria over time course of thirty minutes or so. We used fluorescence imaging with a magnification of 10X to look at the bugs, since they had various fluorescent proteins marking them.
Observations : We still haven't got this assay to work in terms of actually seeing bacteria accumulating, but it seems to be the most promising one. The bacteria are made motile in the usual way, outlined above. The plug is made of M9 agar of the same composition of that in which the bacteria are grown, with 10mM serine added.
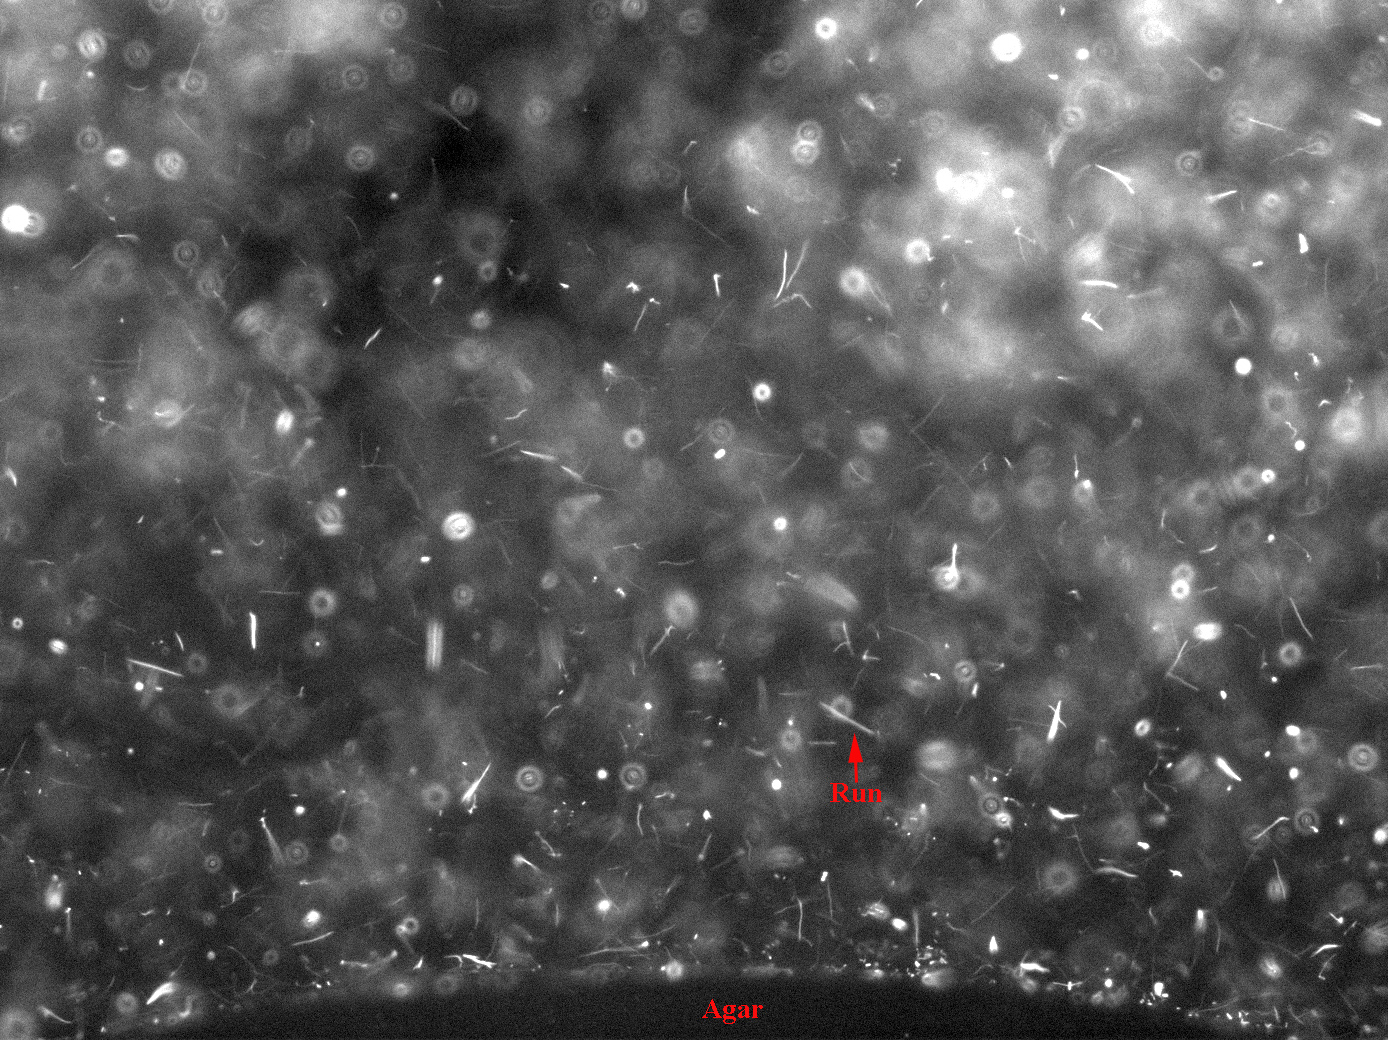
These images were integrated over 1.5 seconds, hence trails of fast bacterial motion or runs can be clearly seen (see label)
There are a few interesting observations we have made in the course of standardising this assay.
- There is a region of frenzied activity just around the agar circumference like a halo. This halo increases in size as time progresses
- When we tried the assay with UU1250 (the strain without repressor) transformed with Tar and Tsr constructs (see images to the right), we observed that cells with lower fluorescence tended to be more motile in the halo, i.e. they had longer and more frequent runs. This is interesting from the viewpoint of receptor levels influencing chemotactic ability.
The above two observations seem to suggest that we have indeed reconstituted chemotactic ability in UU1250, and that beyond a certain receptor concentration, cell motility is affected. However, these are preliminary and qualitative observations which need to be verified.
Chemotaxis Model
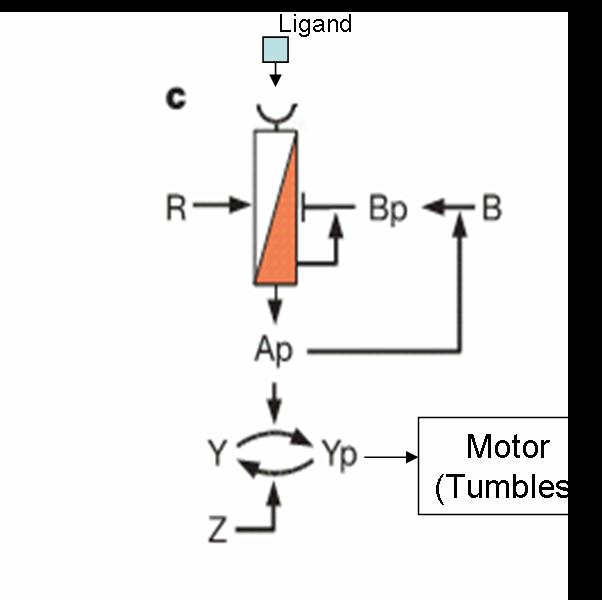
Our aim is to predict movement of colonies of E. coli in two dimensions. The existing machinery in E.Coli exhibits various interesting properties like
- Feedback Control
- Adaptation
- Robustness
- Gain
Possible E.Coli Dynamics
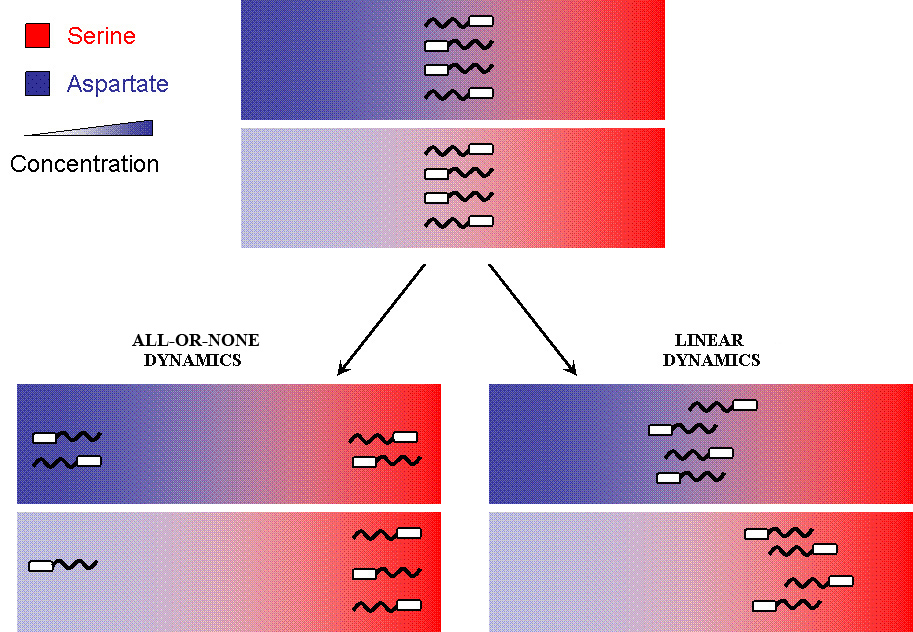
But when the machinery is hacked into and an additional receptor is added, the system develops complex responses to multiple stimuli. Based on the interactions between the two receptors, the cells have two possible responses
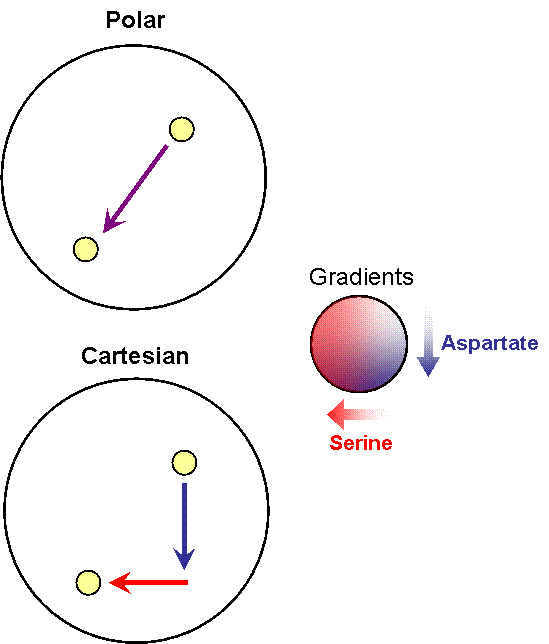
- Receptor 1 gets activated by Ligand 1; but this results in the methylation of both the receptors. Thus, the cell becomes less sensitive to Ligand 2 and longer runs are taken towards Ligand 1. The cells display All-or-none dynamics – two distinct colonies are expected to be found at the end of the experiment. This system can be used to have E. coli movement in Cartesian Coordinates.
- There is no receptor interaction. Then, the cell displays Linear dynamics. This system can be used to have E. coli movement in Polar Coordinates
Note that the large circle represents a plate with stable, orthogonal gradients of serine and aspartate, while the smaller yellow circles are E. coli colonies
The future step for the model is to include a second receptor and try out the system in various dual gradient geometries. The literature suggests that there are interactions between the two types of receptors, but we will have to wait for the model to see what it means on a macroscopic scale.
