ETH Zurich 2006
From 2006.igem.org

standing (L-R): Marco, Alexandra, Arthur, Olga, Dimo, Marko, Robert; in front (L-R):
Adding numbers is easy, isn't it? 1234 plus 5678, for example, is 6912. But how do engineers add binary numbers instead of decimal ones? And how, in the end, can this be done by a living cell? We, the members of the ETH Zurich 2006 iGEM team, are currently working on these questions, whereas the last one seems to be not trivial.
What the addition of numbers has to do with pattern recognition, how our model and the mathematical analysis look like, and how the experiments are realized will be explained on these wiki pages. We wish you a pleasant time with our pages. Enjoy it!
Contents |
Coordination
TODOs
Modeling
- Parts Model the whole System with Sensing, Pops duplexer and Half adder (Marco and Franz) -- probably not
- Model whether a different strength of input is necessary for the AND and XOR Gates (Marco)
- Finish modeling the second AND Gate and find a biological way to implement it and write the DNA and order it (Marco and Robert) -- probably not
- Bring model parameter up to date & update simulation results/senisitivity analysis (Marco)
Lab
Responsible: Robert for the preparatory experiments, Olga for the assembly and testing of the gates.
- Read the literature on the XOR and AND Gates, check carefully for strains needed and compatibility of the parts (Who?)
- Prepare a protocol for parts assembly (Olga)
- Assembly of the chemical sensing device (Franz, Dimo, Robert, Marco, Marko, Olga) DONE
- Test chemical sensing device DONE?
Documentation
Responsible: Alexandra for the registry, Arthur for the Wiki.
- enter lab experience report to registry
- Make a drawing of the DNA to have an overview of which parts will be consecutively on the same DNA piece (Alexandra) (this is part of the #system deployment section --Ajk)
- Revise images & graphics (Marco):
- correct errors
- unify symbols
- extract missing ones from slides, see here
Presentation/Poster and PR
Responsible: Franz for the presentation, Dimo for PR/Poster
- design and write the final presentation (with LaTex beamer class) IN PROCESS
- draw a team logo and find a team name (Franz and Dimo)
- design and order T-Shirts (Dimo)
- setup poster (Dimo), collect info/distribute tasks
Structure:
1. Introduction of the team and ETH Zurich and of the half-adder idea - about 4 min
2. Engineering Part - about 8 min
3. Biological part - about 8 min
(4.) Questions from the audience - 10min (I think, Marco (modelling) and Marko (biology) should also be ready to answer questions)
Schedule
Available as Google Calendar: [http://www.google.com/calendar/render?cid=pqi8ni6gnfj5r3o0np0h4smrr4@group.calendar.google.com iGEM 2006 ETH Zurich]
- Thu 20.7., 1700: kickoff meeting in CNB E 121
- 27.7.-3.8. 1st group phase
- Define project in more detail within two groups
Thu 27.7., 1700: meeting of entire group to share ideas
Thu 3.8., 1700: decision on final project - 15.8. 1700
- Tutorial "Modelling of AND gate"
- Until 20.8.
- Finalize DNA design, order it
- September,October
- Implement design (registry bio-bricks, ordered DNA)
- 27.9.
- Fix the flight dates and send the proposed flights to Jörg
- 23.10.
- Latest point to start getting our presentation going and to finish the iGEM wiki documentation
- 30.10.
- Project documentation on the Wiki has to be complete
- 4./5.11.
- Jamboree in Boston
Participants and availability
- Michael Friedmann:
- Dimo Brockhoff:
- Franz Zürcher:
- Olga Nikolayeva:
- Alexandra Choutko:
- Arthur Korn:
- Robert Schütz:
- Marco Terzer:
- Marko Jovanovic:
finding a project
Finding a project to work on is not easy. Not because it is hard to find interesting projects but because there are too many of them. In the first weeks we did a lot of brainstorming including thoughts about the projects' feasibility. You can find a list of ideas here.
proposed projects
We split up the whole team into two groups, each proposed a project after these two weeks.
- Meat monitor project (Michael, Dimo, Olga, Arthur, Marko)
- Half adder/pattern recognition project (Franz, Alexandra, Robert, Marco)
It was decided to further pursue the Half adder project idea.
design process
system behavorial specification
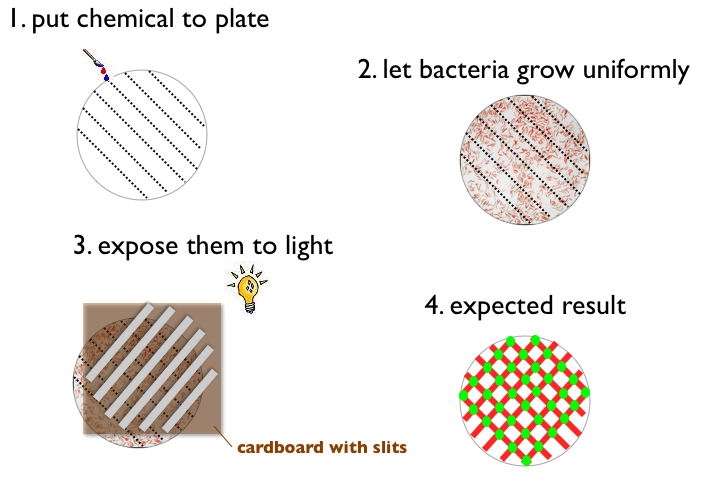
- Write something with a chemical on a petri plate (like ETH for example)
- Let Bacteria grow uniformly on the plate
- Expose the plate to a picture (black and white) of the same pattern
- Result:
- Bacteria gets green when pattern on the plate and picture match (light and chemical)
- Bacteria does not express fluorescent protein when pattern on the plate and picture match (no light and no chemical)
- Bacteria gets red when pattern on the plate and picture do not match
           light   no light
chemical     A         B
no chemical  B         C
The outputs can be reported by fluorescent proteins, the mapping of states to outputs is arbitary, our choice is:
A: green
B: red
C: no fluorescence
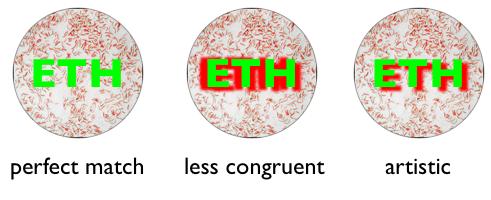
An experiment in the lab could for instance look like this
or like this
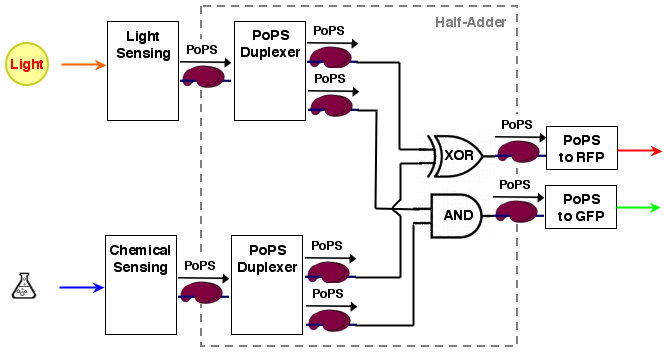
Considering the green and the red output as being separate, the logic mapping the input states to the output states is AND for the GFP and XOR for the RFP. Together they amount to a half adder logic.
The whole system is only considered at it's steady state, dynamic processes are only of minor interest.
system structure
The whole process can be brought into a common input, logic, output form:
[light sensing]----->[       ]-->[reporter A]
                     [ logic ]
[chemical sensing]-->[       ]-->[reporter B]
As it turns out, a [http://en.wikipedia.org/wiki/Full_adder half-adder] can be used as logic part. A half adder can add 2 binary values and thus has 2 inputs. It has also 2 outputs, the sum value S and a carry out C (If an n-bit adder is conststructed from half adders, the carry out of the lower significant bit has to be carried over to the next position).
A half adder can be constructed from an XOR gate (the sum value S) and an AND gate (the carry out):
   A               A
   ^               ^
  1| 1 0         1 | 0 1
  0| 0 1         0 | 0 0
   +-----> B       +----> B
     0 1             0 1

  S = A XOR B    C = A AND B
For our purposes, sum output S and carry out C are exactly the values we desire for our system. the system architecture looks then like the following:
system modeling
according to the system structure, we first decompose our overall system into devices:
for every device, we define the set of ode's (ordinary differential equations) to model the dynamic behavior. our interest is mainly the resulting steady state i.e. when the system reaches equilibra for the concerned species. this means that production and concumption rates are balanced for encymes, metabolites, mRNA etc.
modular simulation
modular modeling allows simulation at different detail levels, e.g.
- single devices, different variants of same device type, as a basis of decisionmaking
- reusable complexes reoccurring in different devices, like
- transcription
- translation
- encymatic reactions
- 2 or several connected devices → for instance to see which duplexer variant fits better with which AND/XOR gate variant
- overall system → to see if everything together still works
we have developed such a modular system in matlab:
- the current implementation defines modules at device level (reusable complexes is a pending issue)
- modules mainly are characterized by number/kind of input and output and can be simulated with an appropriate simulation function
- input/output kind: we destiguish between concentration and rate (PoPS)
- the modules have 1-2 inputs/ouptus, for instance 2 inputs/1 ouptut for AND/XOR gate
parameter estimation & sensitivity analysis
it is known, and we have made the same (sometimes painful) experience that parameter estimation is the most difficult and laborious part on modeling. most parameters are simply not known, and finding an at least roughly appropriate value sometimes approaches playing dice.
one way to address this problem is sensitivity analysis: if we change some parameter, what effect has it on the behavior of the model? we therefore perturbed all parameters and observed the change of the module output. the sensitivity matrix S at steady state can be computed with the jacobian matrices of the ode's with respect to the states (concentrations) and parameters. To be able to compare the results, parameter values are normalized, that is, parameter changes are relative to the assumed parameter value.
sensitivity analysis enables to determine:
- if our model resembles the desired behaviorhttp://2006.igem.org/wiki/index.php?title=ETH_Zurich_2006&action=submit
- unnecessary parameters (can be eliminated)
- contribution of parameters to output behavior (which are the most sensitive parameters)
- validation of expected sensitivity, e.g.
- changing the second input of the AND gate if the first is low should have little influence (and thus low sensitivity)
- correlations: if sensitivity on input is low, parameters correlating with (acting on) the input should be low, too
the role of modeling
with all the uncertainties and difficulties (such as parameter estimation) the question might raise whether modeling is worthwile at all. we definitely think so, but one has to think of modeling as an integrated process. it should not be seen as a precursor phase of experiment and synthesis, it is part of the knowledge cycle.
after brainstorming and idea selection, we started with abstract models of the necessary devices on a very schematic level. for instance, we came up with different theoretical models for the XOR and AND gates - without considering biology too much at this early stage. then, we looked for biological systems which could fit one of our models - literature research was to some extent model driven. we refined the remaining models and simulated the devices for the first time - here, the ode's and matlab joined in. these models helped a lot in deciding which gate variants should be given the preference. but with additional knowledge and key figures about the biological system, the models where constantly adapted.
important is the interaction of model and experiments: what tests/experiments should be done with the synthesized devices? of course, one wants to know wheter it works or not - but what's next? if a certain device does not work as expected, what should we change? here, models and especially sensitivity analysis provide valuable information for experiment planning, for instance it might tell you that increasing the concentration of the input chemical has less influence than reducing the half life time of some proteine. and with the experiments, you gather data about your system, triggering again validation and refinement of the models.
modular scripts
Each file contains a createXXX() script for the device it contains. The created program object contains:
- function handles for reaction rates: r
- stoichiometric matrix: N
- constants (inside of the function handles)
- state (concentration) changes (the ode dy values) can be computed by: N · r
The modules can then be "connected" using the createInOutConnector() function. The result is again a device object, consisting of the connected basic device objects.
sim_1_1 and sim_1_2 can be used to simulate devices with 1 input/1 output and 1 input/2 outputs respectively, both basic and composite devices.
simulations contains the first examples, simulating
- XOR → simulation results / sensitivity analysis
- AND-tRNA → simulation results / sensitivity analysis
- IPTG Sensing →simulation results
- PoPS Duplexer →simulation results
- Compound module: IPTG Sensing → PoPS Duplexer →simulation results
All scripts: [http://csb.inf.ethz.ch/igem-2006/matlab_modules.zip matlab_modules.zip] (<0.1M)
system deployment
distribution on the plasmids, strains
system assembly procedure
system test procedure
modeling
The contents of this section should be placed at the appropriate places in the design process section above and the rest moved to an external page.
Matlab scripts for ODE simulation
old scripts
unzip the file, each zip file contains 2 files: sim_xxx.m and ode_xxx.m.
-
ode_xxx.m: contains the differential equations, i.e. the model -
sim_xxx.m: sets the parameters, calls the simulator and plots the result (this is the one to run, but the other is also needed).
- [http://csb.inf.ethz.ch/igem-2006/matlab_sim_and1.zip matlab_sim_and1.zip] (<0.1M) →simulation results → abandoned
- [http://csb.inf.ethz.ch/igem-2006/matlab_sim_and2.zip matlab_sim_and2.zip] (<0.1M) →simulation results → the pursued version A
- [http://csb.inf.ethz.ch/igem-2006/matlab_sim_and3.zip matlab_sim_and3.zip] (<0.1M) →simulation results → the pursued version B
- [http://csb.inf.ethz.ch/igem-2006/matlab_sim_and4.zip matlab_sim_and4.zip] (<0.1M) →simulation results → abandoned
As a result of the meeting on August 17, we will from now on concentrate on the AND versions 2 and 3.
- [http://csb.inf.ethz.ch/igem-2006/matlab_sim_xor1.zip matlab_sim_xor1.zip] (<0.1M) →simulation results → the only pursued version
- [http://www.tik.ee.ethz.ch/~brockho/igem2006/matlab_sim_xor2.zip matlab_sim_xor2.zip] (<0.1M) →simulation results → abandoned
- [http://www.tik.ee.ethz.ch/~brockho/igem2006/matlab_sim_xor3.zip matlab_sim_xor3.zip] (<0.1M) →simulation results → abandoned
Sensoring
- [http://csb.inf.ethz.ch/igem-2006/matlab_sim_iptg.zip matlab_sim_iptg.zip] (<0.2M) →simulation results


