Results
From 2006.igem.org

Fluorescence complementationBack to McGill University Main Page
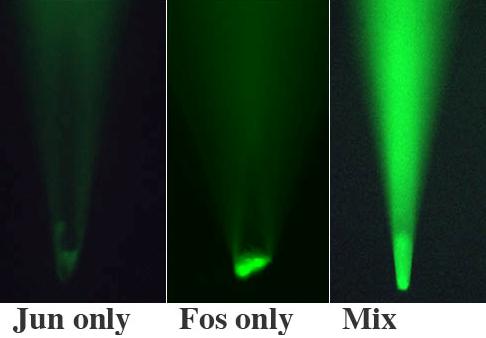
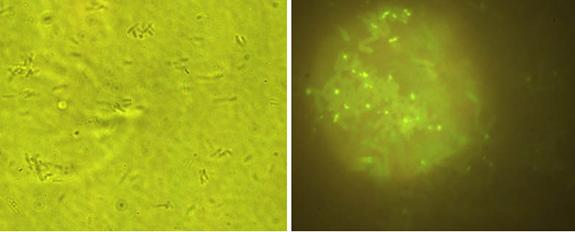
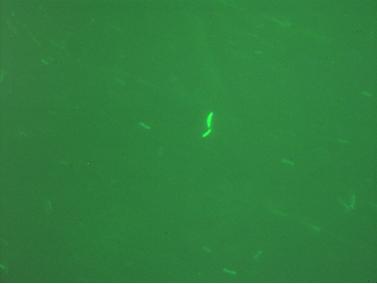
ResultsWe think we see fluorescence complementation! However, the expression seems rather fragile. Leaving the tubes overnight in the fridge or pipetting bacteria onto a dry slide wipes out the expression. It’s also not completely clear if the pattern of expression makes sense—we expected to see cells fluoresce only where they touch. So there are still some details to work out, but we saw some cool things!
 Figure 2. Mixing of Jun- and Fos-expressing cells in a culture dish using a patch pipette. The phase contrast image shows a concentrated solution of Jun-expressing cells alone; the middle panel shows the fluorescence from these cells. In the right-hand panel, Fos was added from gentle pressure against the patch pipette approximately 60 s before the image was taken.
Back to McGill University Main Page |


