EdinburghModeling
From 2006.igem.org
Contents |
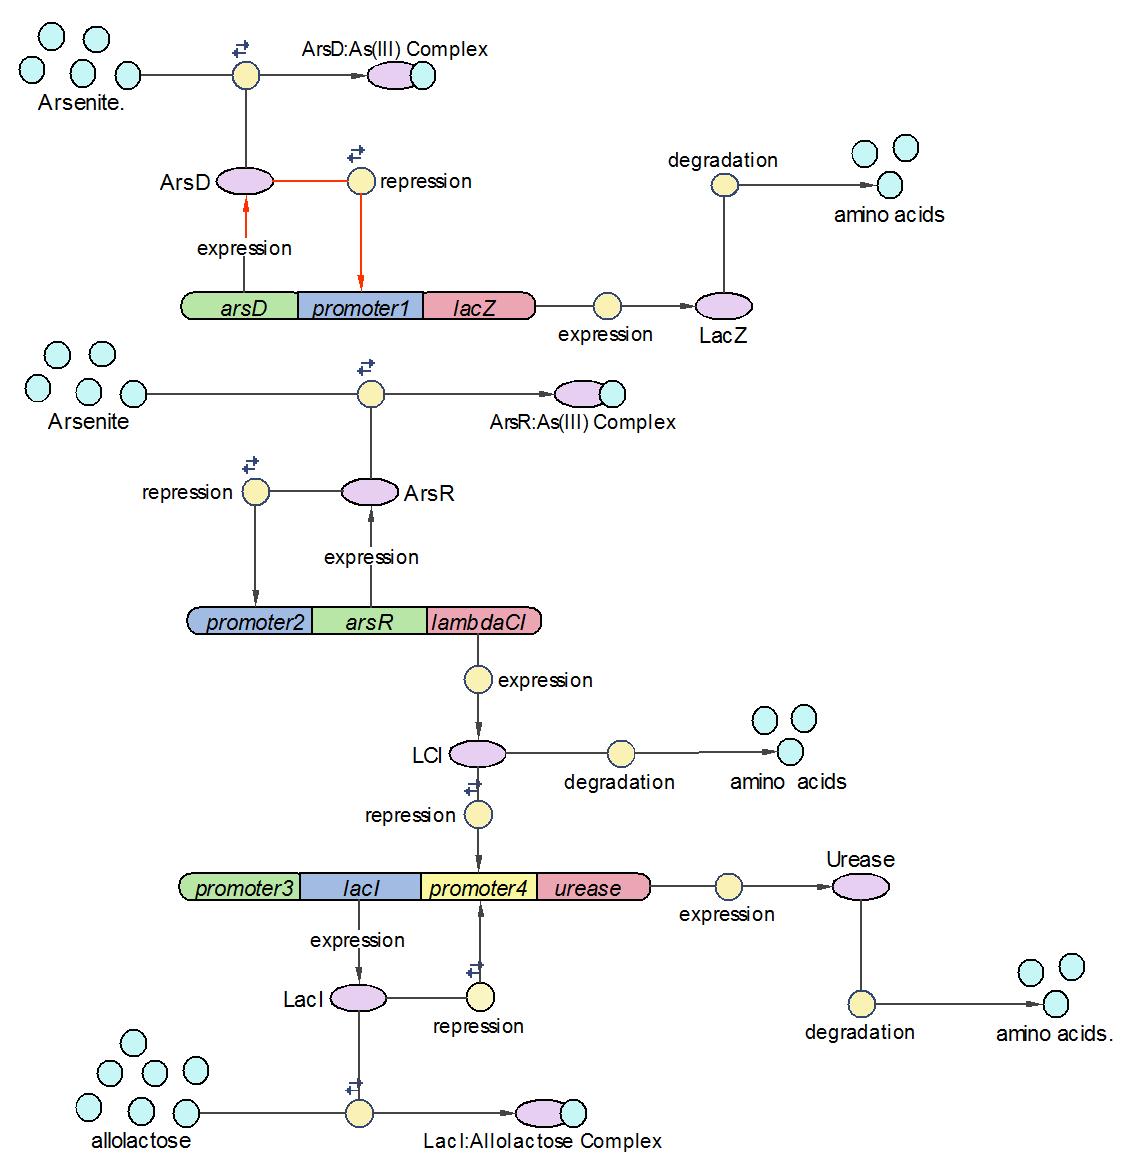
System Diagram of Arsenic Biosensor
Reaction set
| No. | Name | Equation | Rate Law | Parameters |
| 1 | ArsD binding to Arsenic (III) | ArsD+2As(III)=ArsD-2As(III) | Mass Action | K1=1000 K-1=0.65 |
| 2 | ArsD binding to promoter1 | 2 ArsD+promoter1=2ArsD-promoter1 | Mass Action | K2=10000, K-2=0.65 |
| 3 | ArsD degradation | ArsD->null | Mass Action | K3=0.05 |
| 4 | ArsD production | promoter1->promoter1+ArsD | Michaelis-Menten | V4m=0.5, K4m=75 |
| 5 | ArsR binding to Arsenic (III) | ArsR+2As(III)=ArsR-2As(III) | Mass Action | K5=1000, K-5=0.65 |
| 6 | ArsR binding to promoter2 | 2ArsR+promoter2=2ArsR-promoter2 | Mass Action | K6=10000, K-6=0.65 |
| 7 | ArsR degradation | ArsR->null | Mass Action | K7=0.05 |
| 8 | ArsR production | promoter2->promoter2+ArsR | Michaelis-Menten | V8m=10, K8m=25 |
| 9 | LacI binding to allolactose | LacI+allolactose=LacI-allolactose | Mass Action | K9=10000, K-9=0.1 |
| 10 | LacI binding to promoter4 | LacI+promoter4 = LacI-promoter4 | Mass Action | K10=1000, K-10=0.5 |
| 11 | LacI degradation | LacI->null | Mass Action | K11=0.1 |
| 12 | LacI production | promoter3->promoter3+LacI | Michaelis-Menten | V12m=0.5, K12m=40 |
| 13 | lacZ degradation | lacZ->null | Mass Action | K13=0.1 |
| 14 | lacZ production | promoter1->promoter1+lacZ | Michaelis-Menten | V14m=25, K14m=10 |
| 15 | LCI binding to promoter 4 | LCI+promoter4=LCI-promoter4 | Mass Action | K15=10000, K-15=0.5 |
| 16 | LCI degradation | LCI->null | Mass Action | K16=0.1 |
| 17 | LCI production | promoter2->promoter2+LCI | Michaelis-Menten | V17m=10, K17m=25 |
| 18 | Urease degradation | Urease->null | Mass Action | K18=0.1 |
| 19 | Urease production | promoter4->promoter4+Urease | Michaelis-Menten | V19m=10, K19m=40 |
Note: The units for first, second and third order rate constants are expressed in units of second^-1, nMol^-1*second^-1 and nMol^-2*second^-1 respectively.
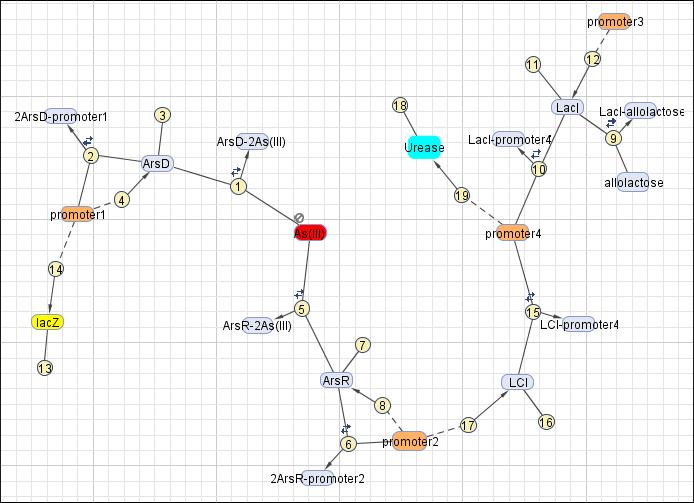
This reaction map is generated from the reaction set above using Simbiology Toolbox.
Initial concentration
| No. | Species | Intial Concentration (nMol) |
| 1 | ArsD | 25 |
| 2 | As(III) | 40 |
| 3 | 2ArsD-promoter1 | 25 |
| 4 | promoter1 | 5 |
| 5 | ArsR | 25 |
| 6 | 2ArsR-promoter2 | 25 |
| 7 | promoter2 | 5 |
| 8 | LCI | 4 |
| 9 | LacI | 0.1 |
| 10 | LacI-allolactose | 0.1 |
| 11 | allolactose | 1000 |
| 12 | LacI-promoter4 | 0.1 |
| 13 | promoter4 | 25 |
| 14 | LCI-promoter4 | 0.1 |
| 15 | Urease | 0.1 |
| 16 | promoter3 | 5 |
| 17 | Other species | 0 |
Methodology
Software used
In order to model the quantitative behavior of the dynamic system, many modeling software systems have been developed in the past few years. In this project, three kinds of software systems are used for modeling. This section introduces their functions and features.
1. System biology toolbox for Matlab: SimBiology toolbox provides functions for modeling, simulating, and analyzing biochemical pathways on basis of the powerful computing engine of Matlab. Aside from the conventional typing reaction equation, SimBiology provides a user-friendly ‘dragging-and-dropping’ block diagram editor to build a new model. Thanks to the powerful computing ability of Matlab, SimBiology integrates a wide range of numerical solvers for both stochastic and deterministic simulations. Another strength of SimBiology is its analyzing ability which includes sensitivity analysis, parameter estimation and conservation of moieties. Last but not the least, SimBiology provides user-defined plotting function which was widely used in this research project. However SimBiology is commercial software, it costs the budgeted researchers extra expense to purchase the license for this toolbox. Also, there is no GUI for sensitivity analysis and parameters scan functions, so users should obtain the skill of programming with Matlab.
Results
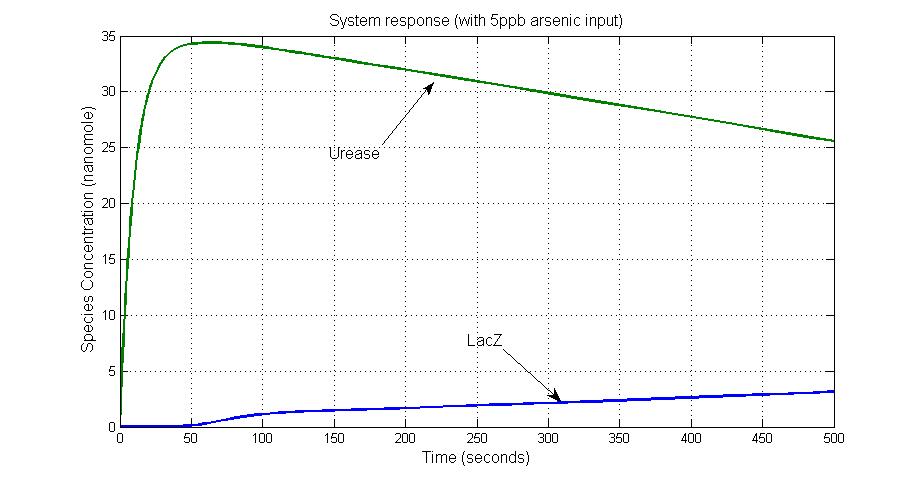
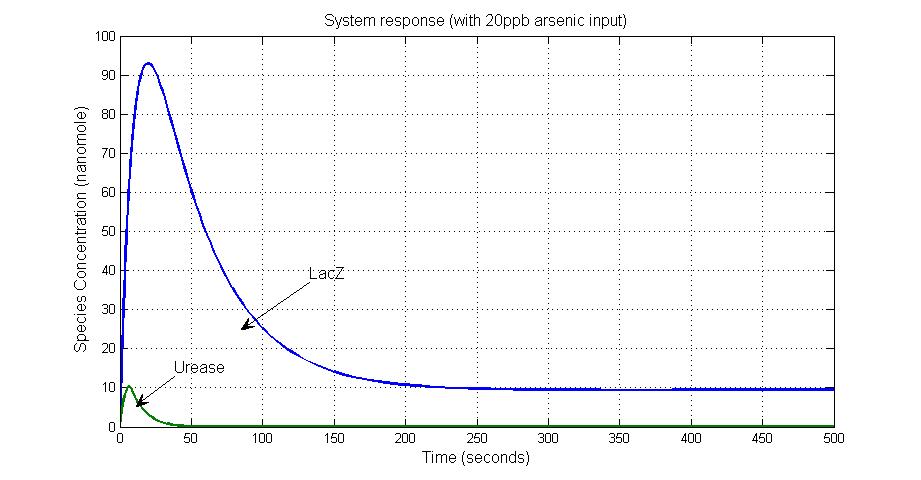
System response
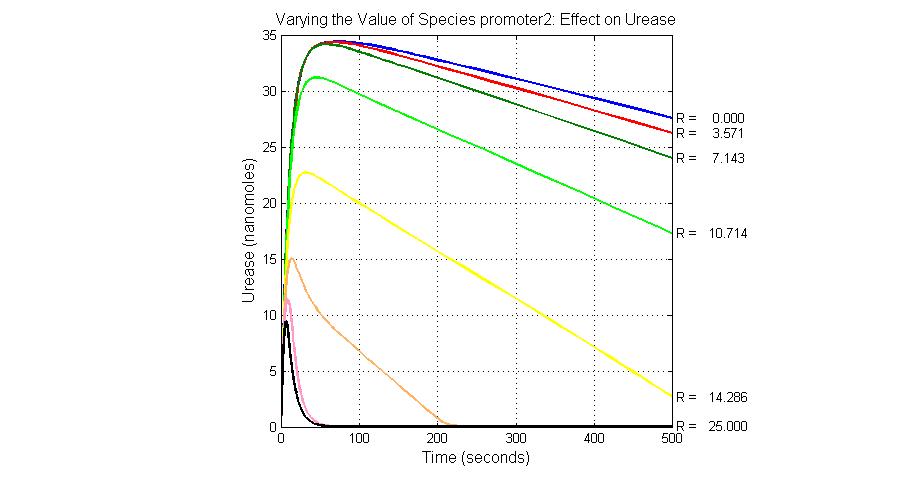
Parameter sensitivity analysis
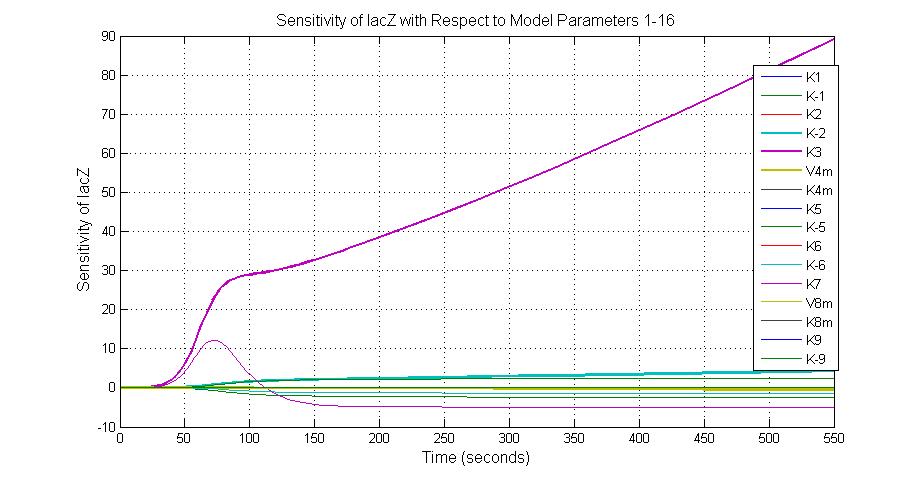
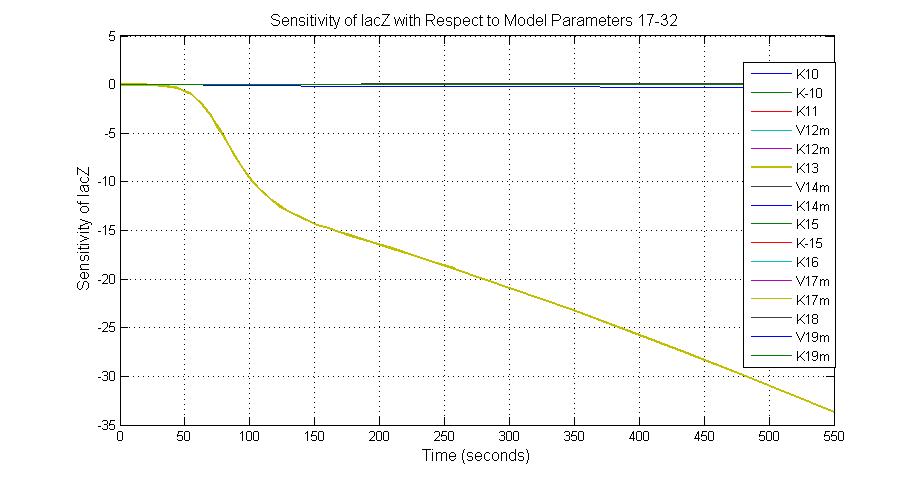
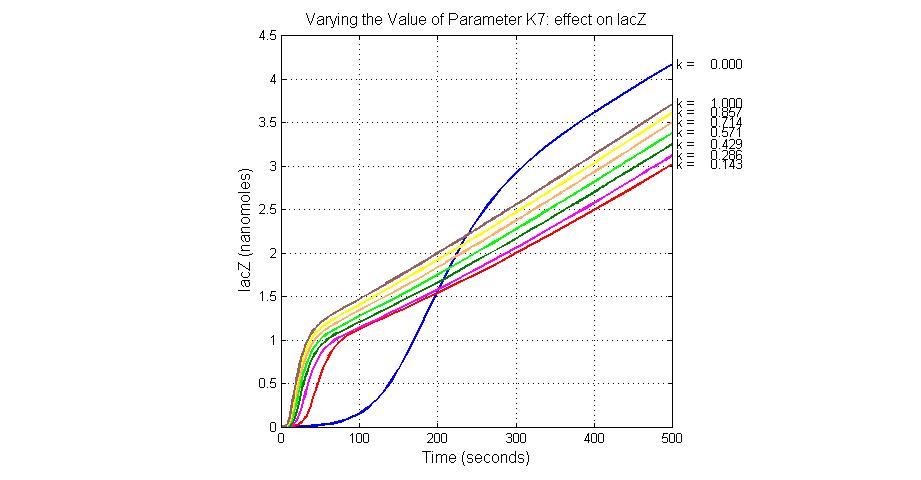
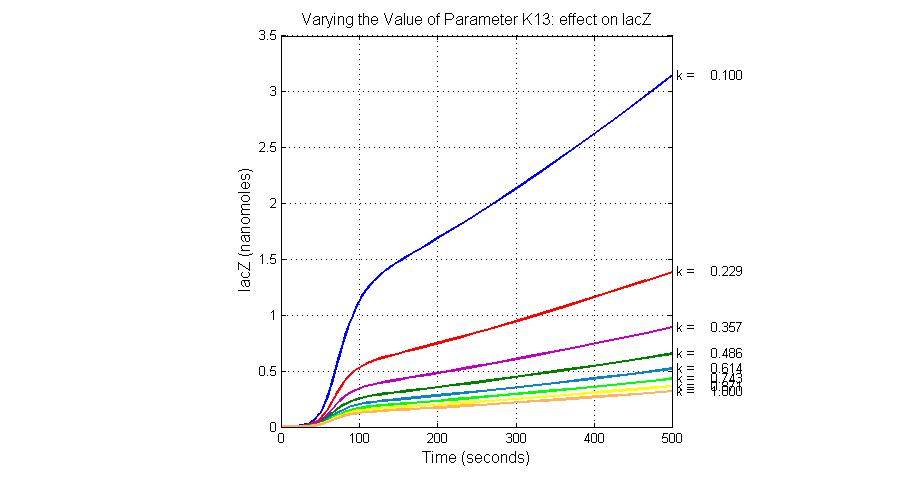
The most sensitive parameters affecting lacZ
| Nanme | Description | Peak value of sensitivity | Normal value |
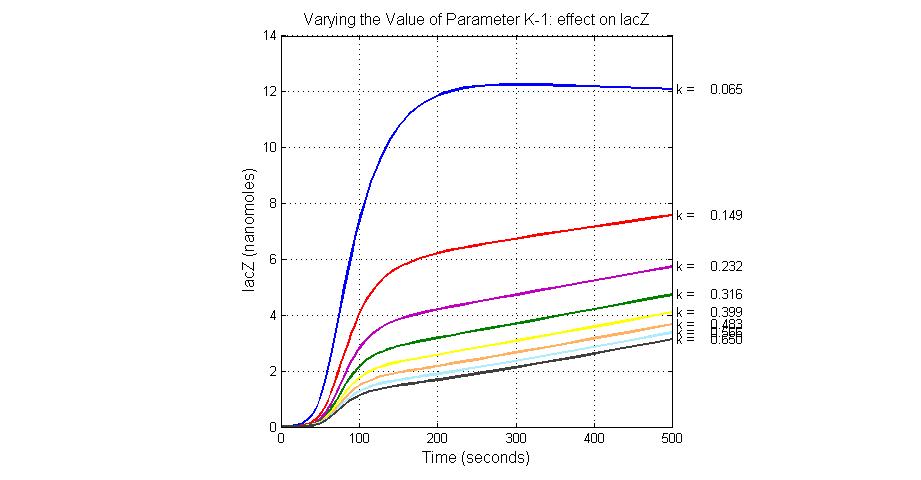
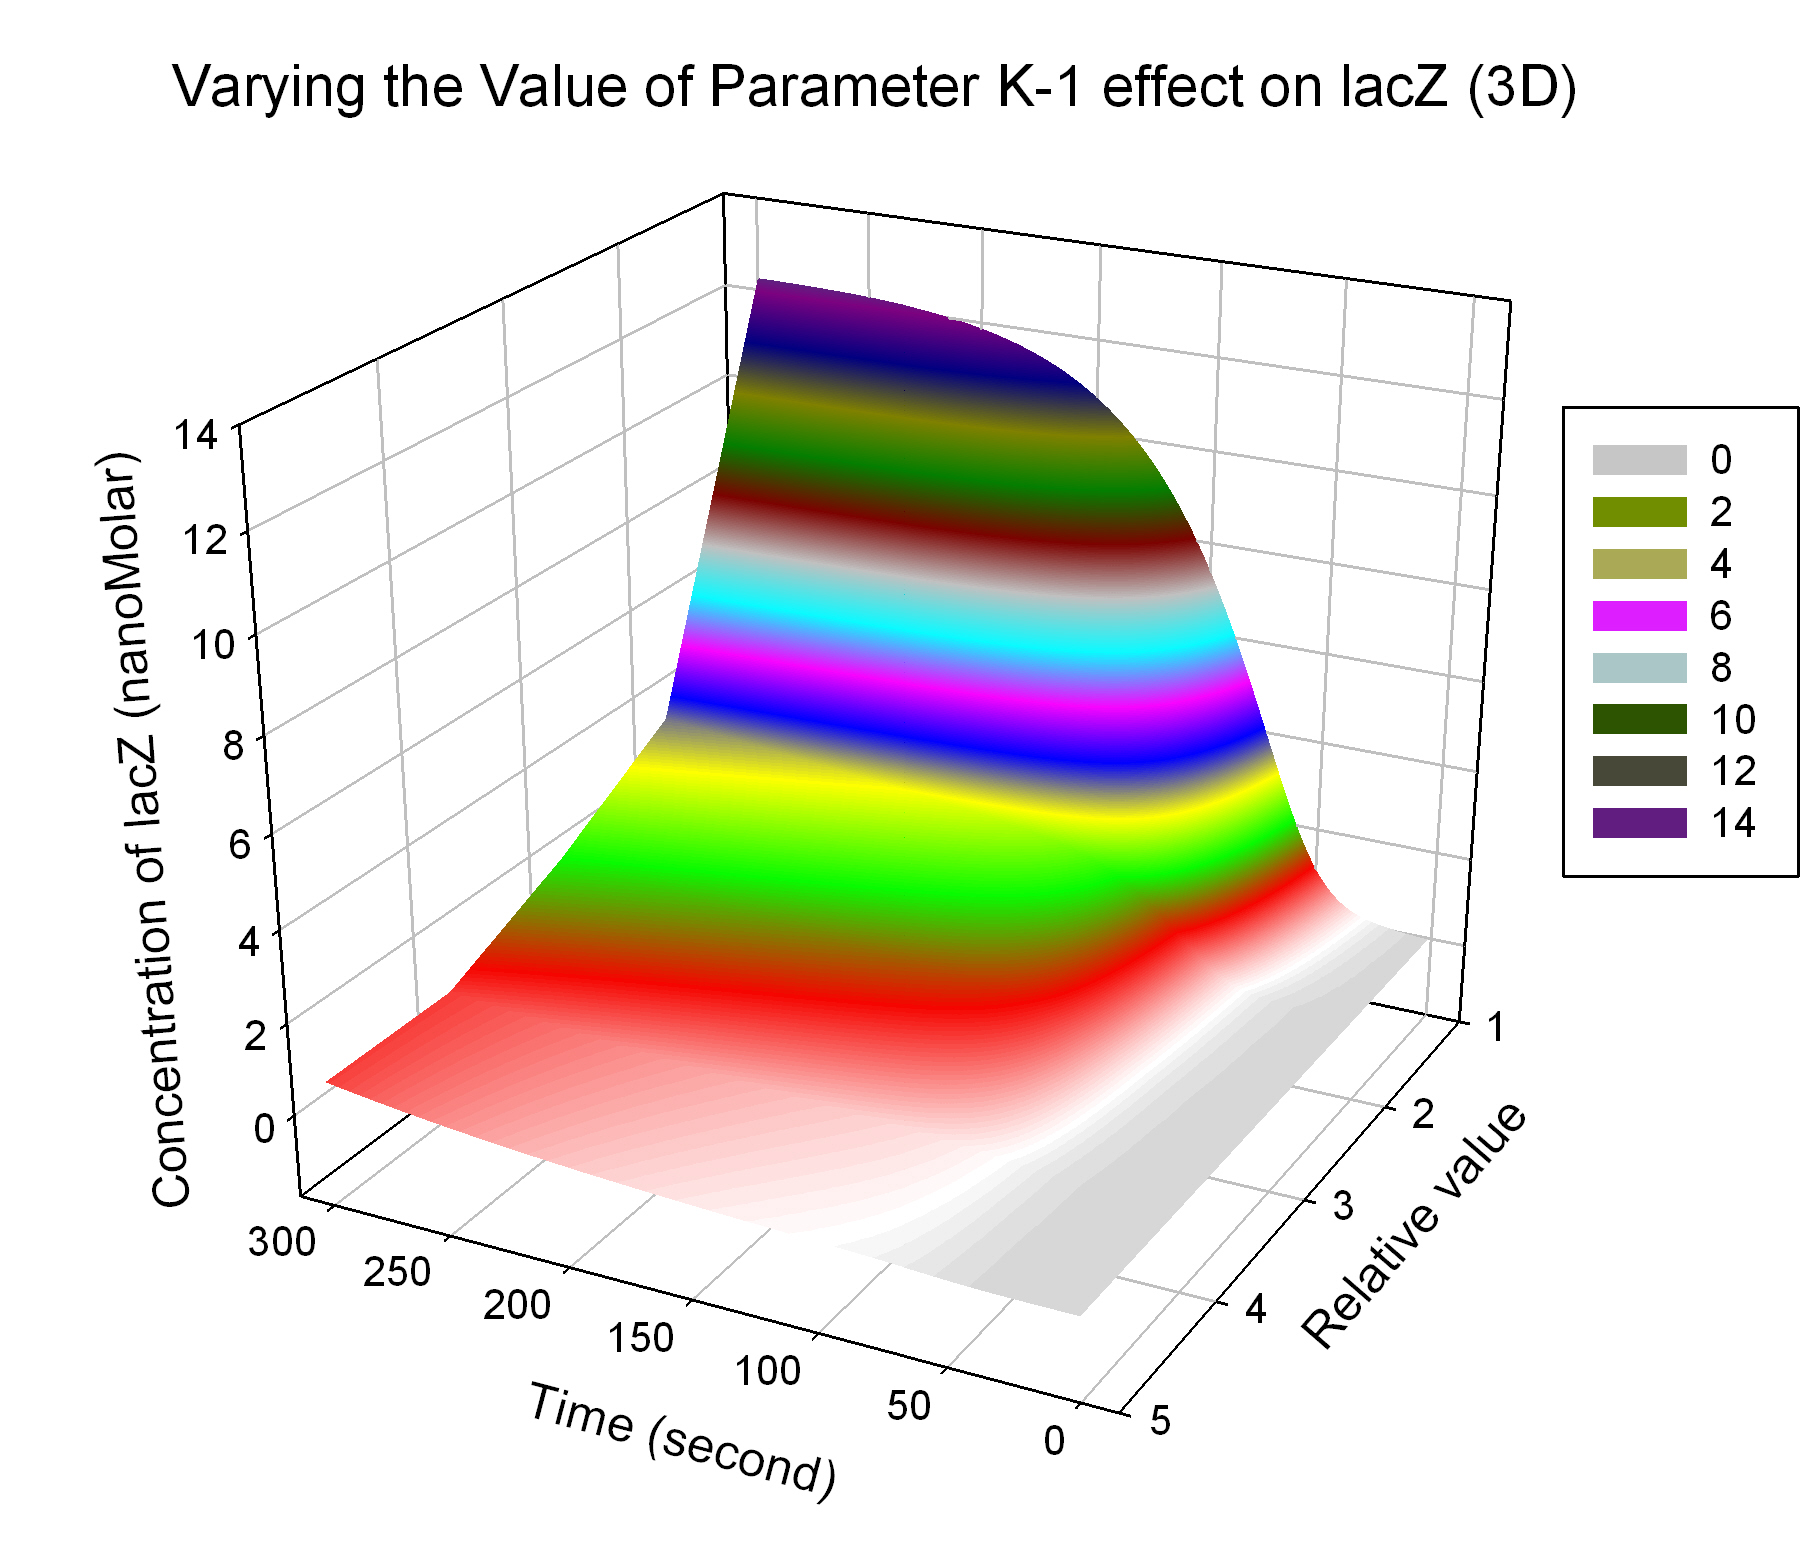
| K-1 | ArsD-2AS(III) dissociate rate | -2 | 0.65/s |
| K-2 | 2ArsD-promoter1 dissociate rate | 4 | 0.65/s |
| K3 | ArsD degradation rate | 90 | 0.05/s |
| K7 | ArsR degradation rate | 12 | 0.05/s |
| K13 | LacZ degradation rate | -35 | 0.1/s |
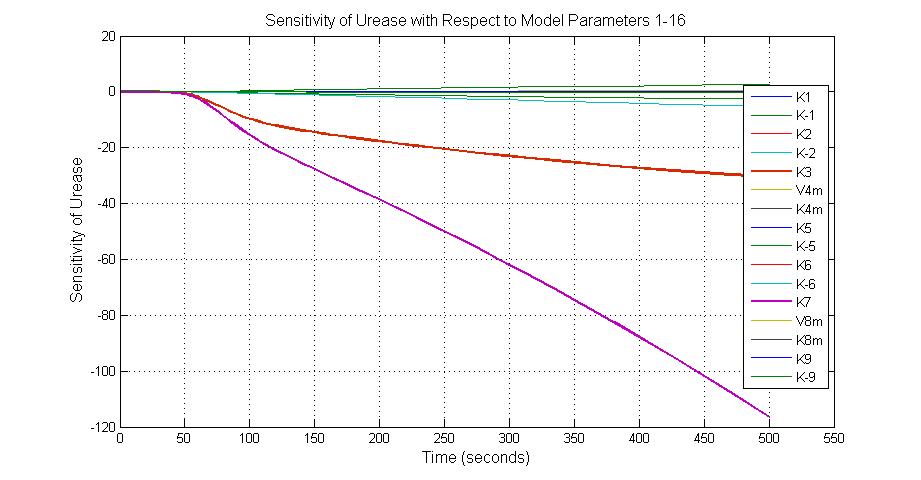
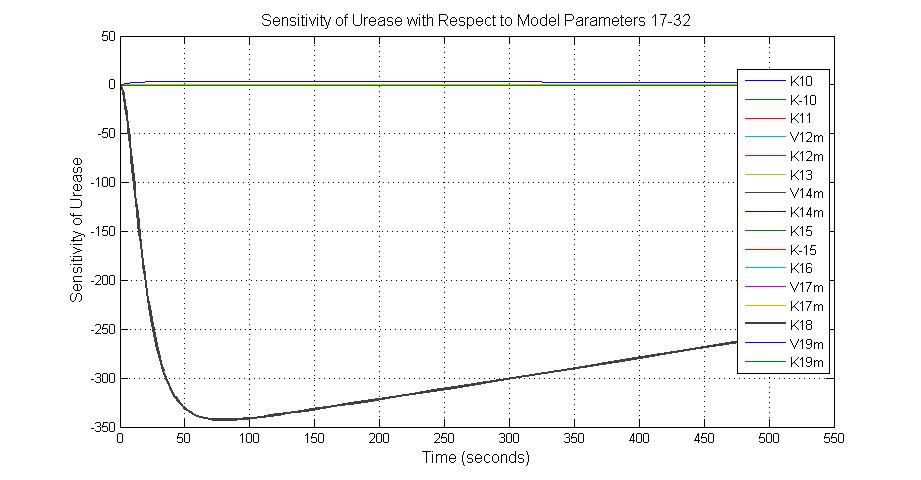
The most sensitive parameters affecting Urease
| Nanme | Description | Peak value of sensitivity | Normal value |
| k3 | ArsD degradation rate | -30 | 0.05/s |
| k-6 | 2ArsR-promoter2 dissociate rate | -5 | 0.65/s |
| k7 | ArsR degradation rate | -120 | 0.05/s |
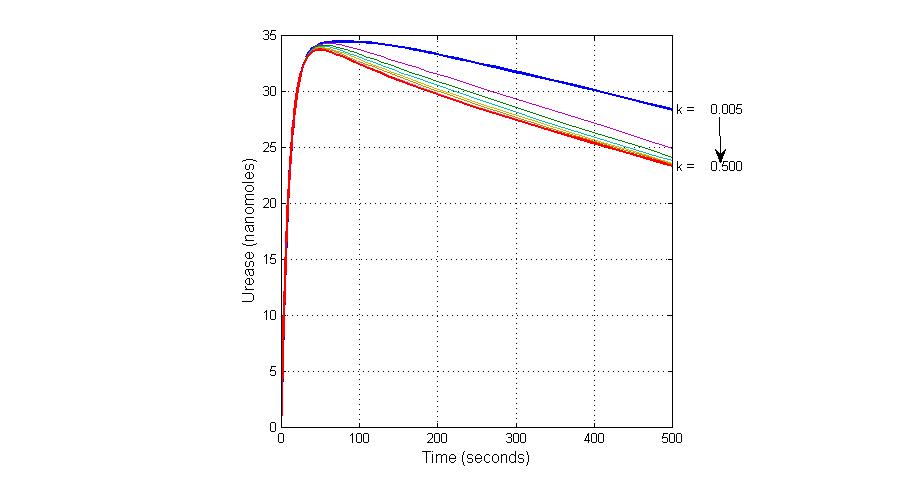
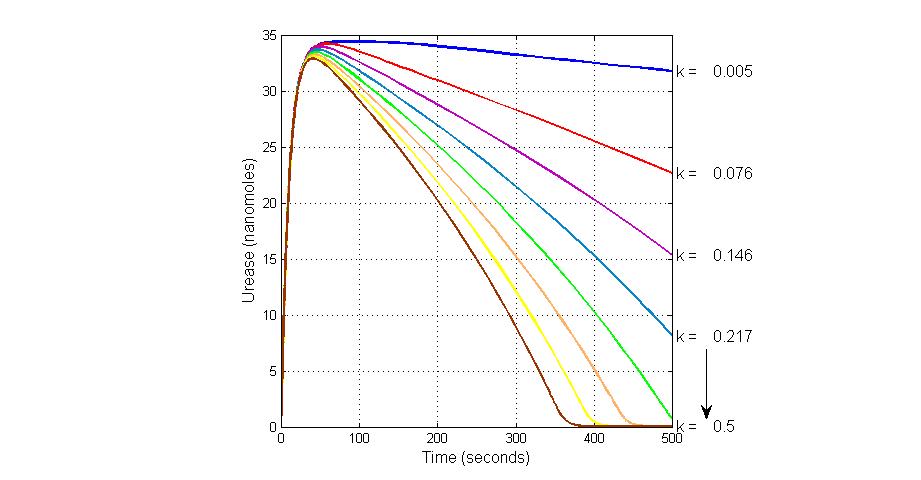
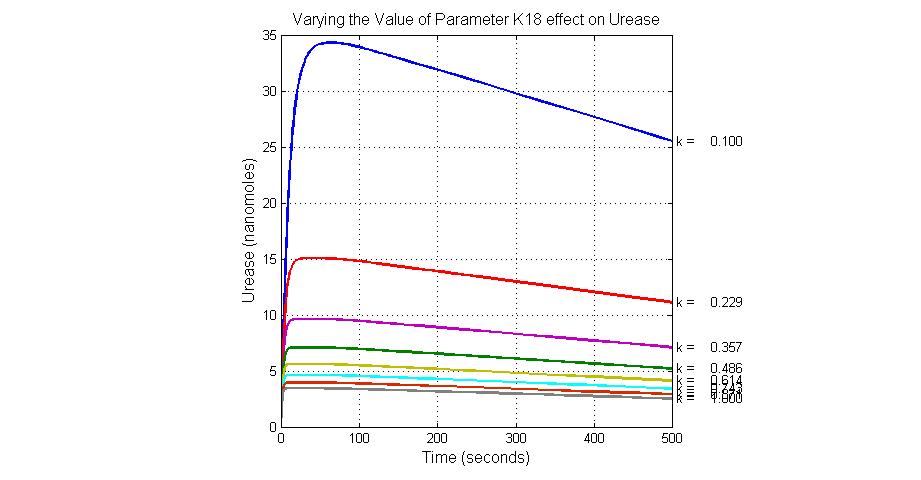
| K18 | Urease degradation rate | -350 | 0.1/s |
| V19m | Urease production maxium rate | 3.5 | 10 nMol/s |
Species sensitivity analysis
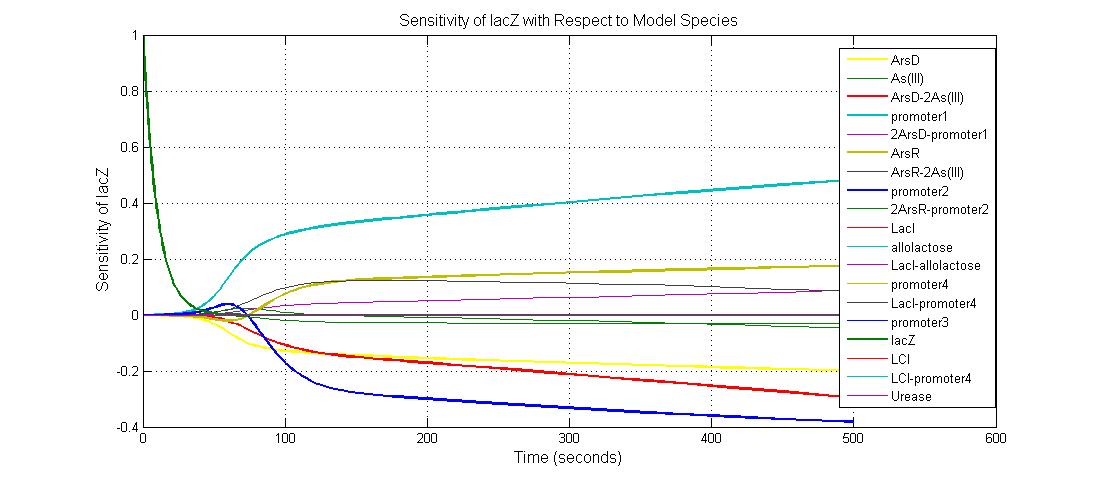
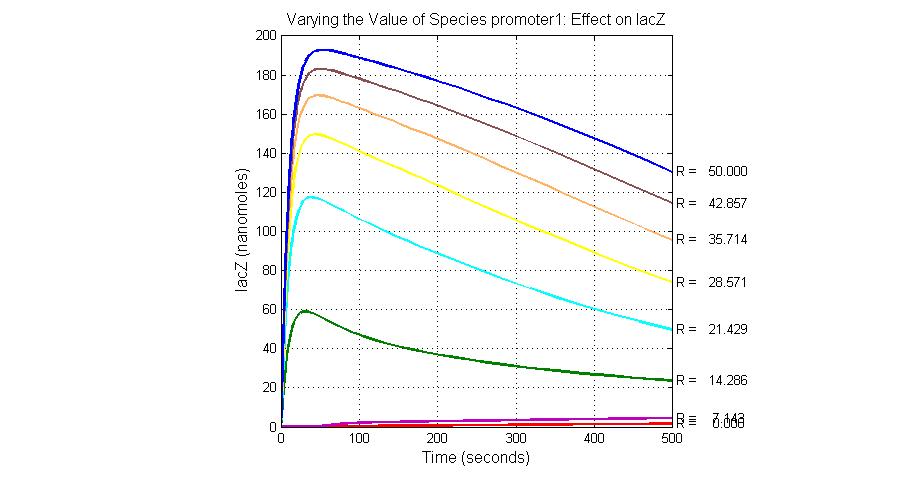
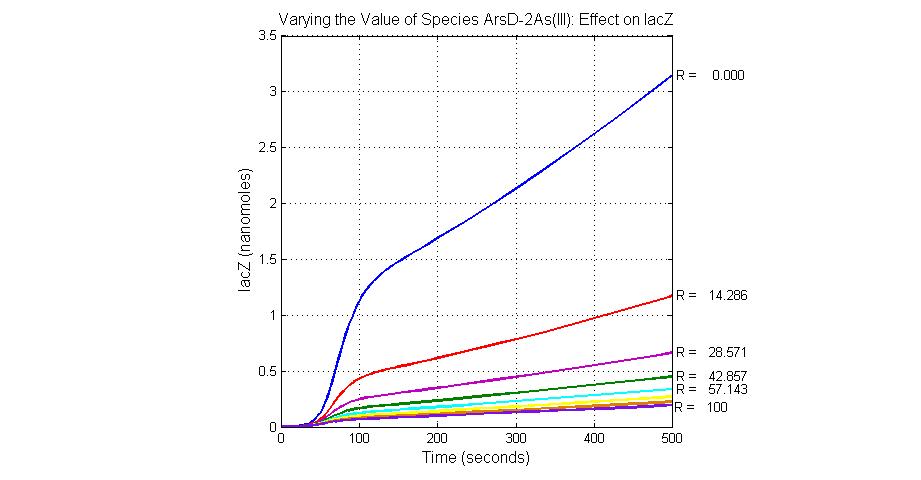
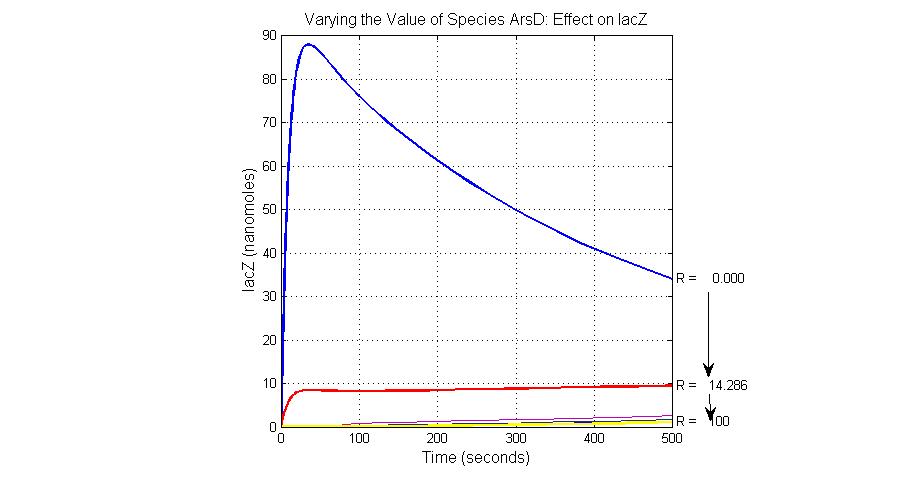
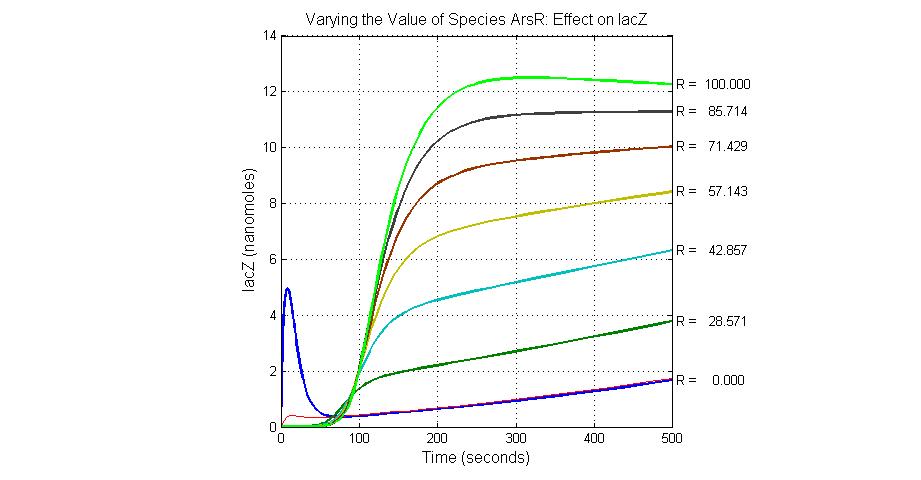
The most sensitive species affecting lacZ
| Name | Initial concentration (nMol) |
| promoter1 | 5.0 |
| promoter2 | 5.0 |
| ArsD-2As(III) | 0 |
| ArsD | 25 |
| ArsR | 25 |
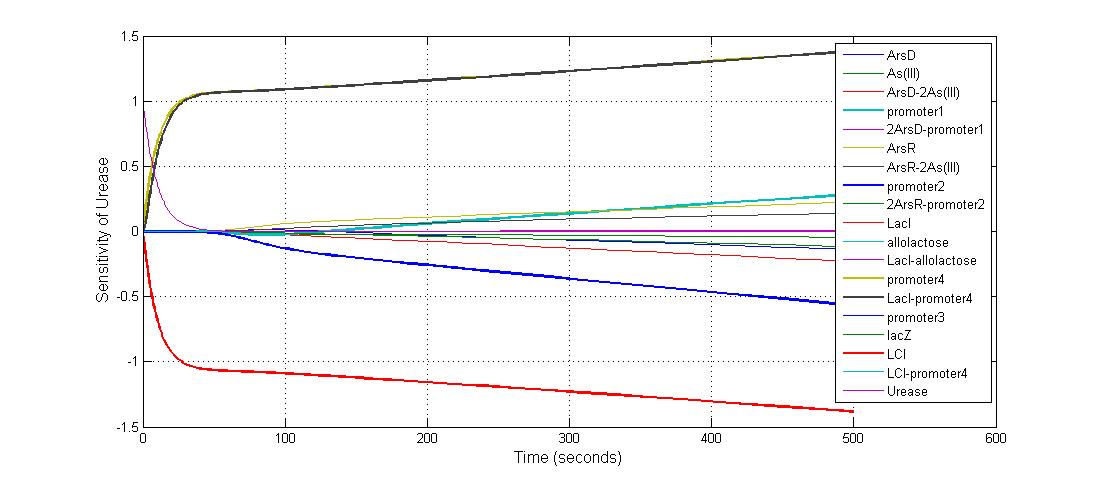
The most sensitive species affecting Urease
| Name | Initial concentration (nMol) |
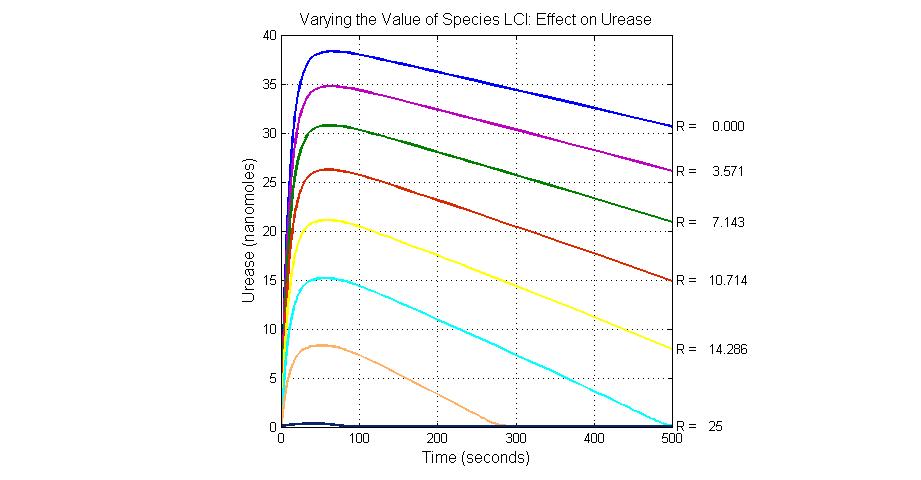
| LCI | 4 |
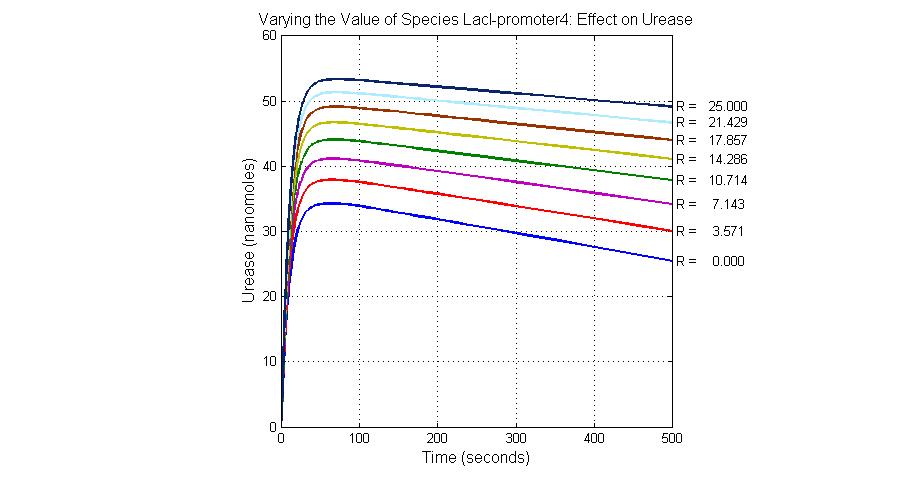
| LacI-promoter4 | 0.1 |
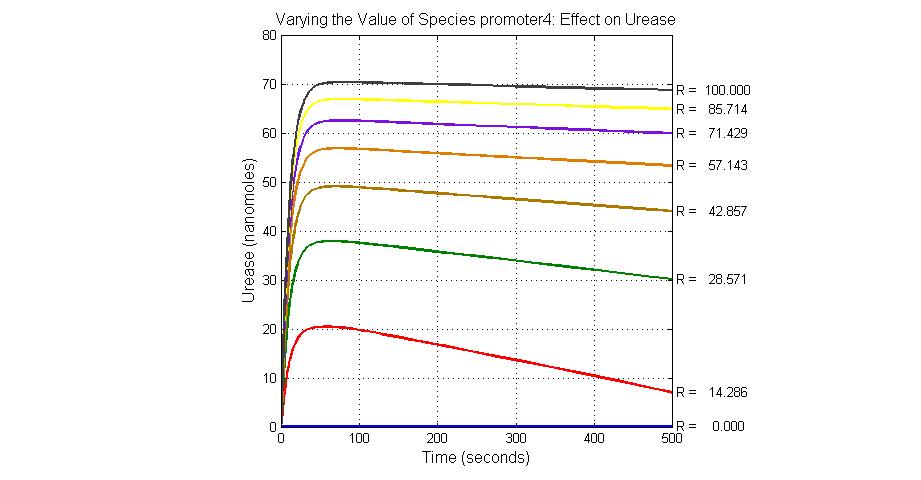
| promoter4 | 25 |
| promoter2 | 5 |
| promoter1 | 5 |
