Biosensor Characterisation
From 2006.igem.org
Culture conditions
Where compositions of culture media are given, the compositions of stock solutions are as follows:
Ampicillin: stock solution 100 mg/ml; typical final concentration 100 micrograms/ml.
IPTG: stock solution 90 mg/ml; typical final concentration 90 micrograms/ml.
Lactose: stock solution 20% w/v; typical final concentration 2% w/v.
Unless otherwise specified, all cultures were incubated at 37 degrees C with shaking. Initially (experiments 1 to 9) cultures were in 250 ml conical flasks, typically with 50 ml of medium unless otherwise specified. After experiment 9, acquisition of a semi-micro pH electrode allowed us to use sealed 20 ml vials containing 5 ml of culture medium, allowing larger numbers of cultures to be run in parallel.
Experiment 1 - Effect of solution volume on rate of pH response
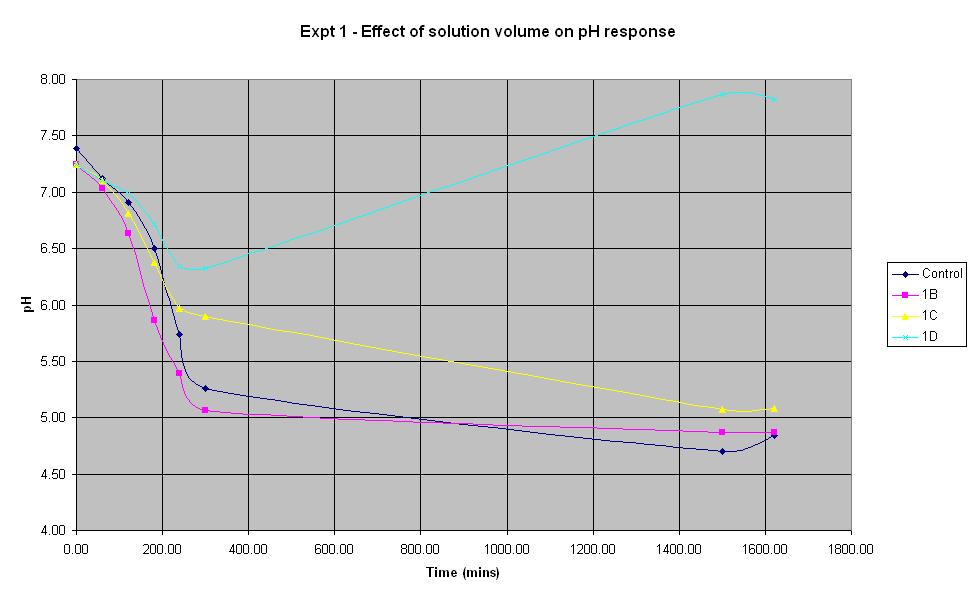
Experiment 1 was carried out using IPTG responsive E. coli (JM109) with a plasmid carrying lacZ' (pBluescript SK+, Stratagene) to find out what difference the total volume of solution in a 250 ml shake-flask makes to the rate of pH change. Cultures were shaken at 37 C.
| Experiment: | Control | 1B | 1C | 1D |
| Solution volume c.f control: | 100% | 50% | 20% | 10% |
| Experiment: | Control | 1B | 1C | 1D |
| LB (ml): | 50 | 25 | 10 | 5 |
| Culture (ml): | 5 | 3.125 | 1.25 | 0.625 |
| Lactose (ml): | 1.25 | 0.781 | 0.313 | 0.156 |
| Ampicillin (μl): | 10 | 6.25 | 2.5 | 1.25 |
| IPTG (μl): | 10 | 6.25 | 2.5 | 1.25 |
| Total volume (ml): | 56.27 | 28.919 | 11.568 | 5.784 |
The solution with total volume 28.1375 ml (1B) produced the fastest initial rate of pH decrease and reached approximately the same final pH as the control (pH 4.84).
The smallest solution volume changed pH at the slowest rate and after an initial decrease in pH, it then increased to 7.87 overnight.
Therefore, in the optimum order, 1B > Control > 1C > 1D
Experiment 2 - Effect of solution dilution on rate of pH response
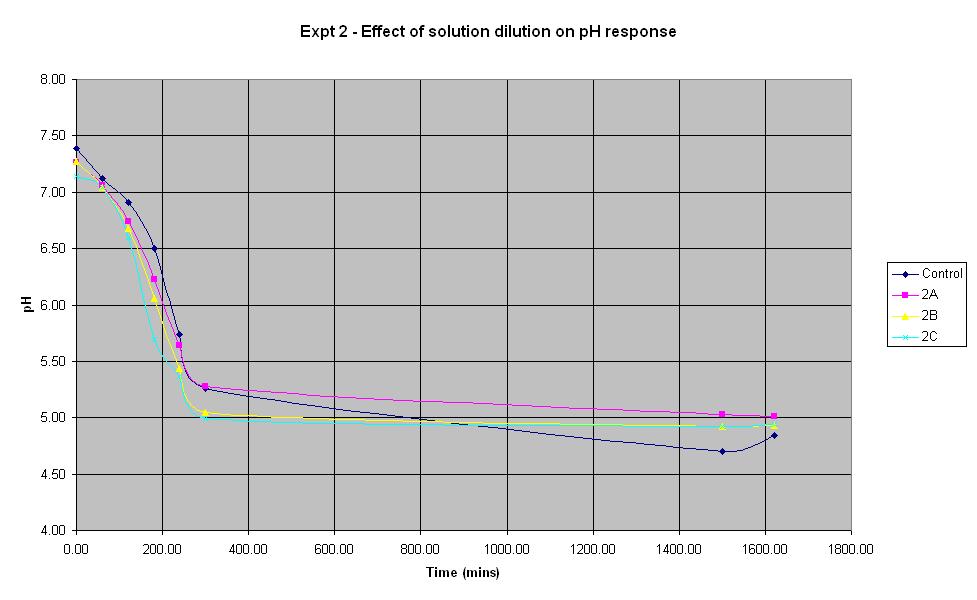
Experiment 2 again used E. coli JM109/pBluescript SK+ to find out what difference the volume of sterile water added to the solution makes to the rate of pH change. This is important since in the final system, water samples will need to be added to the culture.
| Experiment: | Control | 2A | 2B | 2C |
| Sterile water (ml): | 0 | 50 | 25 | 10 |
| Experiment: | Control | 2A | 2B | 2C |
| LB (ml): | 50 | 50 | 50 | 50 |
| Culture (ml): | 5 | 5 | 5 | 5 |
| Lactose (ml): | 1.25 | 1.25 | 1.25 | 1.25 |
| Ampicillin (μl): | 10 | 10 | 10 | 10 |
| IPTG (μl): | 10 | 10 | 10 | 10 |
| Sterile water (ml): | 0 | 50 | 25 | 10 |
| Total volume (ml): | 56.27 | 106.27 | 81.27 | 66.27 |
It can be seen that all the dilutions behave in roughly the same way, especially when the error in pH of +/- 0.2 is taken into account. The aim of this experiment was to find out whether it is feasible to dilute the standard culture solution by 50%. The pH of solution 2A which was diluted by 50% decreased at a rate very similar to that of the control solution, therefore it will be feasible to use this dilution in the final biosensor.
Experiment 3 - Effect of shaking on rate of pH response
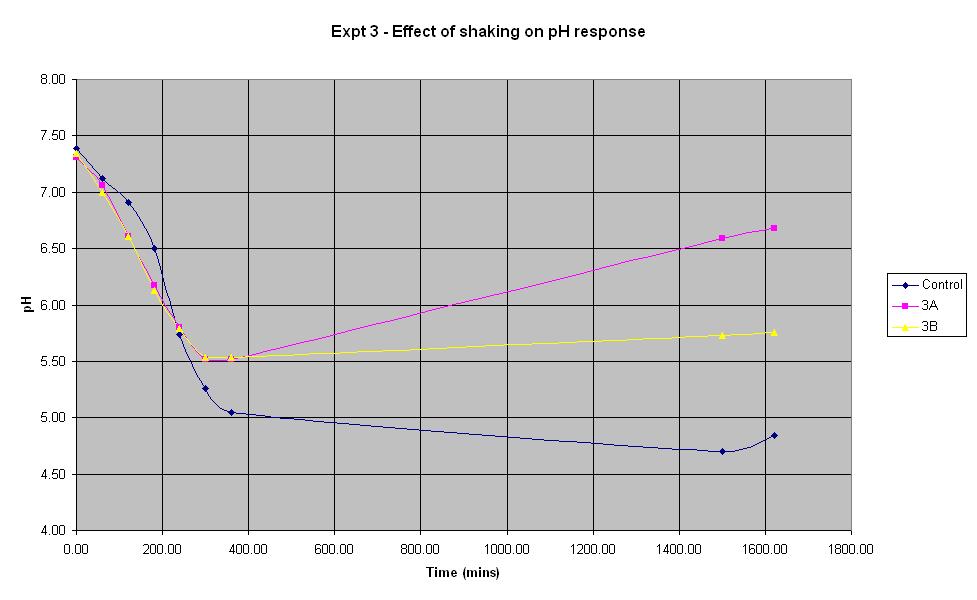
Experiment 3 again used E. coli JM109/pBluescript SK+ to find out what effect shaking has on the rate of pH change.
| Experiment: | Control | 3A | 3B |
| Shaken: | Yes | No | No |
The composition of solutions 3A and 3B is the same as that of the control (which is the identical to the control composition used in experiment 1). The only difference in the experiment is that neither solution 3A or 3B is shaken whereas the control is.
It can be seen that for the first 4 hours, the pH of the unshaken cultures decreases at a faster rate than that of the shaken control culture. However, the pH of the unshaken cultures stops falling after approximately 5 hours and begins to increase again. This shows that for the initial experimental period, it is not necessary to shake the biosensor but following the first 5 hours (approximately), shaking becomes more important.
Experiment 4 - Effect of air volume on rate of pH response
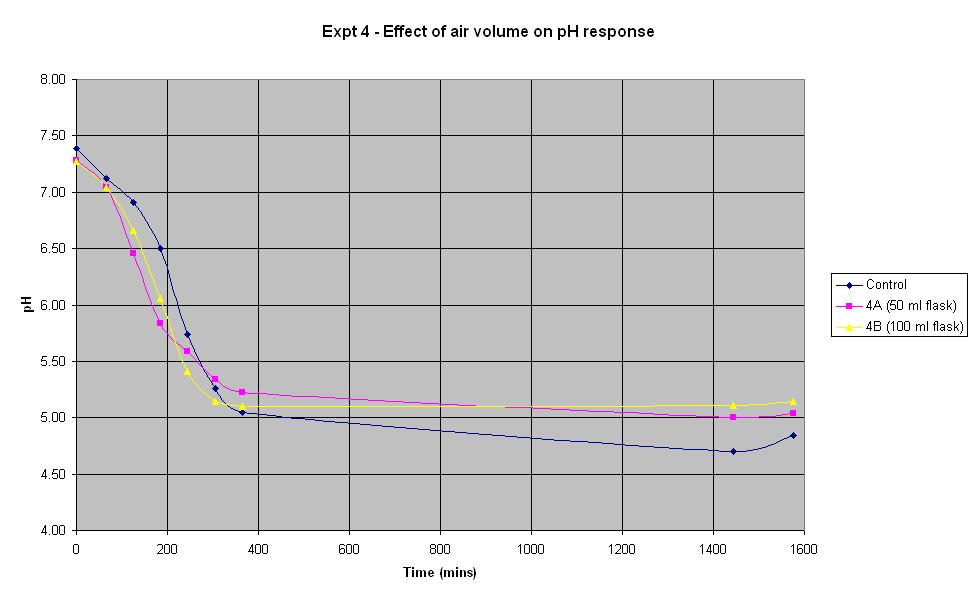
Experiment 4 was conducted using different conical flask sizes to find out what effect the volume of air present has on the rate of pH change of IPTG responsive E. coli with lacZ. Again the JM109/pBluescript SK+ strain was used.
| Experiment: | Control | 4A | 4B |
| Conical flask size (ml): | 250 | 50 | 100 |
The composition and volume of 4A, 4B and the control solution is that used for the control in Experiment 1 above. The only difference in the experiment is the conical flask volume. The control is a 250 ml flask, 4A is a 50 ml flask and 4B is a 100 ml flask.
In the first 4 hours, the flask containing the smallest volume of air responded at the fastest rate. After about 5 hours, both 4A and 4B seemed to plateau out at a final pH just above 5 whilst the control continued to decrease slightly. However, if an error in pH of +/- 0.2 is considered, it can be seen there is not much difference in the rate of response between the flasks containing different air volumes.
Experiment 5 - Effect of freezing on pH universal indicator
This experiment was planned but not actually carried out as it became apparent that it would be better to freeze-dry the bacteria and nutrients rather than freezing them at -80 °C.
Experiment 6 - Effect of arsenic concentration on rate of pH change of arsenic responsive E-Coli (Biobrick construct 1)
When the biobrick assembly was complete, two constructs of different lengths were produced from the gel electrophoresis. Both constructs were thought to be functional and were tested as such. Biobrick constructe 1 and 2 were thought initially to be the same device, only with a slightly different length of DNA.
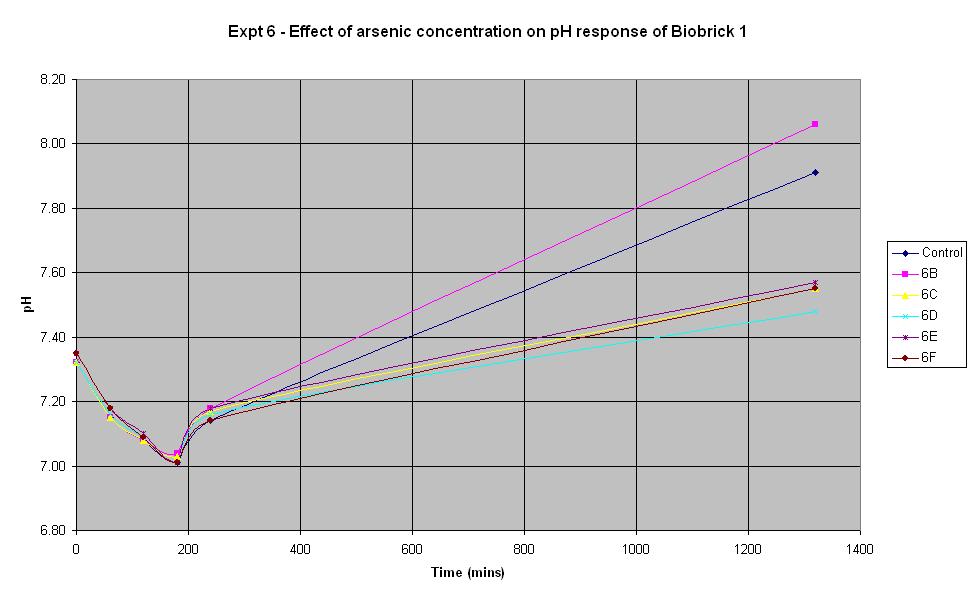
Experiment 6 was carried out using Biobrick construct 1 which has an arsenic promoter coupled to a LacZ. This construct was made from the arsR operon that was extracted from B. subtilis and ligated to a lacZ operon from E. coli. Different concentrations of arsenic were added to the solution in an attempt to induce a response.
| Experiment: | Control | 6B | 6C | 6D | 6E | 6F |
| Arsenic (ppb): | 0 | 5 | 10 | 20 | 50 | 500 |
| Experiment: | Control | 6B | 6C | 6D | 6E | 6F |
| LB (ml): | 50 | 50 | 50 | 50 | 50 | 50 |
| Culture (ml): | 5 | 5 | 5 | 5 | 5 | 5 |
| Lactose (ml): | 1.25 | 1.25 | 1.25 | 1.25 | 1.25 | 1.25 |
| Ampicillin (μl): | 10 | 10 | 10 | 10 | 10 | 10 |
| Arsenic (μl): | 0 | 3.3 | 6.6 | 13.2 | 33 | 330 |
| Total volume (ml): | 56.273 | 56.274 | 56.277 | 56.283 | 56.303 | 56.600 |
The results above show that the concentration of arsenic present does not affect the response of BioBrick construct 1 under the conditions shown in the table. Initially there is a decrease in pH in all tests but we believe this is due to the bacteria metabolising nutrients present in the LB medium to produce an acidic waste product. Then once this nutrient is consumed, the bacteria begin to break down amino acids, also present in the medium and this leads to the subsequent increase in pH. The fact that the pH only decreases slightly at the start indicates that they are not breaking down the lactose to acid which shows that this Biobrick construct is not functioning correctly. It was thought that this would be the case with one of the constructs so this is a useful result.
Experiment 7 - Effect of arsenic concentration on rate of pH change of arsenic responsive E-Coli (Biobrick construct 2)
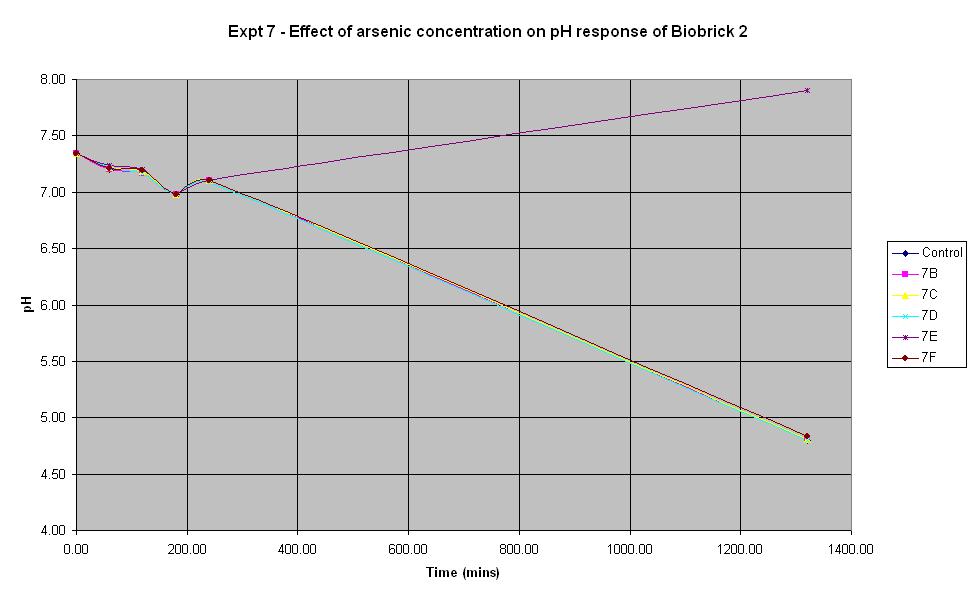
Experiments 7, 8 and 9 were carried out using the 2nd segment of DNA that was extracted from the gel electrophoresis. This construct was also made from the arsR operon that was extracted from B. subtilis.
| Experiment: | Control | 7B | 7C | 7D | 7E | 7F |
| Arsenic (ppb): | 0 | 5 | 10 | 20 | 50 | 500 |
The composition of the solutions used in this experiment are the same as those used in Experiment 6 except the culture used is Biobrick construct 2 rather than 1.
It looks like 7B is an anomolous reading as none of the other experiments led to an increase in pH. The pH decreases from the start and continues to decrease over time. This indicates that the bacteria are breaking down the lactose to acid which shows that the LacZ part of this Biobrick construct is functioning correctly. However, the results above show that the concentration of arsenic present does not affect the response of BioBrick construct 2 under the conditions shown in the table. This could mean that either the arsenic responsive part is not functioning correctly or else all of the concentrations of arsenic tried in this experiment are too low to induce a response different to that of the control.
Experiment 8 - Effect of arsenic and lactose concentration on rate of pH change of arsenic responsive E-Coli (Biobrick construct 2) - Repeat
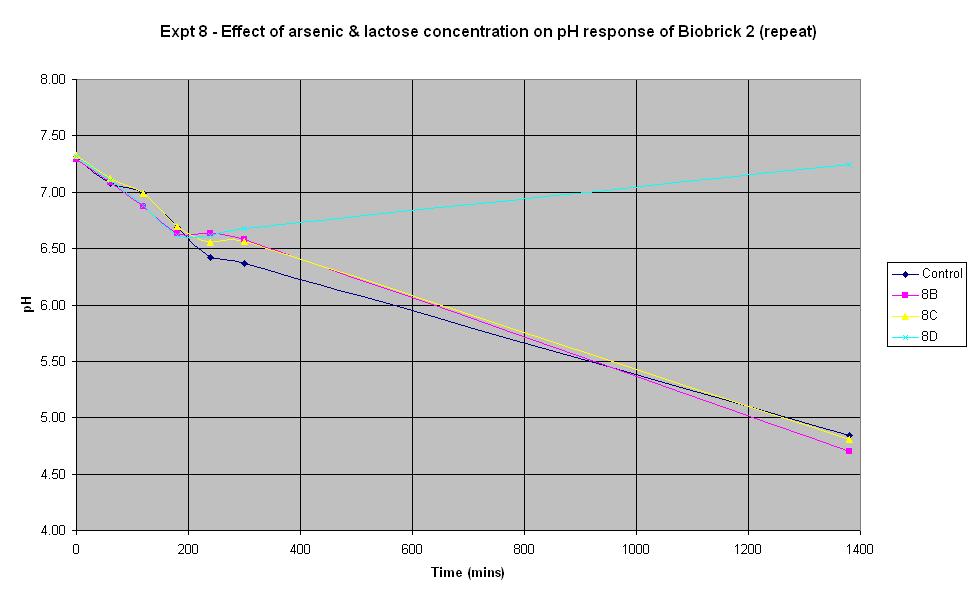
Experiment 8 was carried out using the same construct as experiment 7. Different concentrations of arsenic and lactose were added to the solution to see which concentration produced a response.
| Experiment: | Control | 8B | 8C | 8D |
| Arsenic (ppb): | 0 | 500 | 5000 | 0 |
| Experiment: | Control | 8B | 8C | 8D |
| LB (ml): | 50 | 50 | 50 | 50 |
| Culture (ml): | 5 | 5 | 5 | 5 |
| Lactose (ml): | 2.5 | 2.5 | 2.5 | 0 |
| Ampicillin (μl): | 150 | 150 | 150 | 150 |
| Arsenic (ml): | 0 | 0.33 | 3.3 | 0 |
| Total volume (ml): | 57.65 | 57.98 | 60.95 | 55.15 |
The composition of the solutions used in this experiment differ from those in Experiments 6 and 7 above. 150 μl of ampicillin was used as it was suggested that increasing the volume of ampicillin could improve the response. However, it may have been too much in this experiment and have adversely affected the results! Experiment 8D was carried out with no lactose and no arsenic present in order to see what the effect of this was. It can be seen that there was an initial decrease in pH which is thought to be due to the bacteria metabolising nutrients in the LB broth to produce an acidic waste product. Once this nutrient ran out, the pH increased and it may be that this is due to the breakdown of amino acids, also present in the LB.
The pH decrease is almost identical in the control run, 8B and 8C, especially when errors in the pH measurement are taken into account. This implies that the Biobrick construct 2 is still not responding to the presence of arsenic, even when there is as much as 5000 ppb in the solution. It seems that the decrease in pH is due to the breakdown of lactose to acid, indicating that the LacZ part is functioning all the time, even when there is no arsenic present.
Experiment 9 - Effect of arsenic and lactose concentration on rate of pH change of arsenic responsive E-Coli (Biobrick construct 2) - Repeat 2
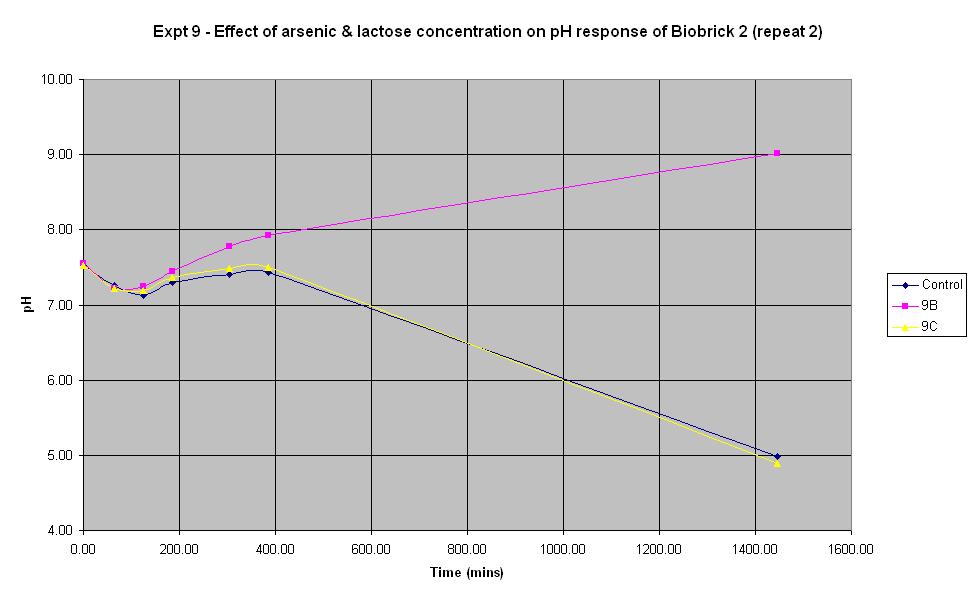
Experiment 9 was carried out using the same construct as experiments 7 and 8. Different concentrations of arsenic and lactose were added to the solution to see which concentration produced a response. This time, the pH electrode was sterilised with ethanol between each reading in order to prevent any cross-contamination which may have affected previous results.
| Experiment: | Control | 9B | 9C | 9D |
| Arsenic (ppb): | 0 | 0 | 500 | 5000 |
| Lactose (ml): | 2.5 | 0 | 2.5 | 2.5 |
The results from experiments 6 - 9 were quite disappointing. It was discovered that the construct for experiment 6 was in a lacZ restricted strain of E. coli, so the experiment was neveer going to work. Experiments 7 - 9 were expected to work and when the results came up negative, the construct used was sequenced in an attempt to determine the cause of the problem. The sequencing results indicated that the end of the arsR gene was missing and the lacZ operon had not been included in the sequence. However, the fact that pH did decrease suggested that lacZ must be present, suggesting that some rearrangement of the DNA must have occurred. In any case, it was clear that lacZ was not adjacent to the ars promoter. This would explain why the control was experiencing the same decrease in pH. It was decided to return to using an E. coli sourced arsR gene with an E. coli lacZ operon. The results for this construct are shown in experiments 10 - 12.
Experiment 10 - Effect of arsenic concentration on rate of pH change of arsenic responsive E-Coli
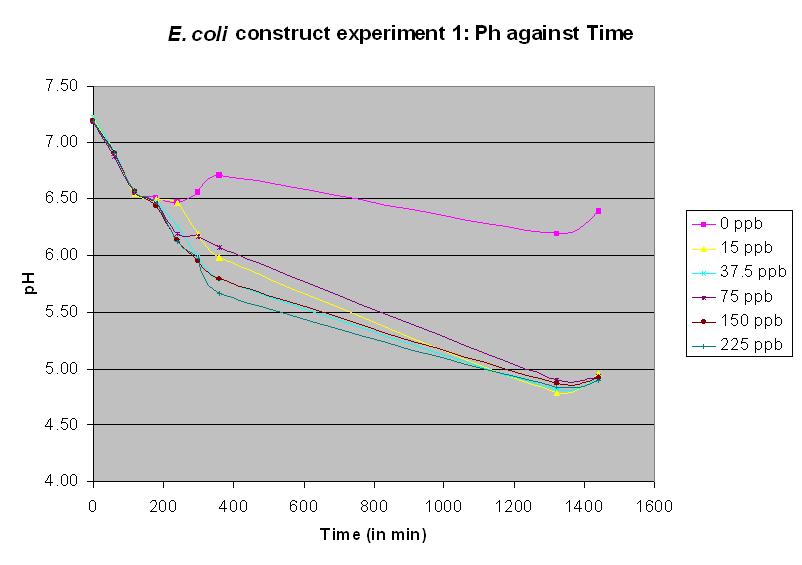
Experiments 10 - 12 were performed using a JM109 strain with a construct now called: Biobrick BBa_J33203. This has the E. coli chromosomal ars promoter and arsR gene joined to lacZ. This is a functional biobrick and the following three experimental results indicate that it is a functional arsenic biosensor. The protocol was also modified. Since we had now acquired a semi-micro pH electrode, it was no longer necessary to use 250 ml conical flasks; we were now able to use 5 ml cultures in sealed 20 ml vials. Again, these were shaken at 37 C. In experiment 10, different concentrations of arsenic were added to the solution to test the sensitivity of the promoter. It was the most successful test up to this time, and showed a pH response for all arsenic concentrations except the control. The table of results is no longer necessary and only the graph will be displayed.
Experiment 11 - Effect of arsenic concentration on rate of pH change of arsenic responsive E. coli
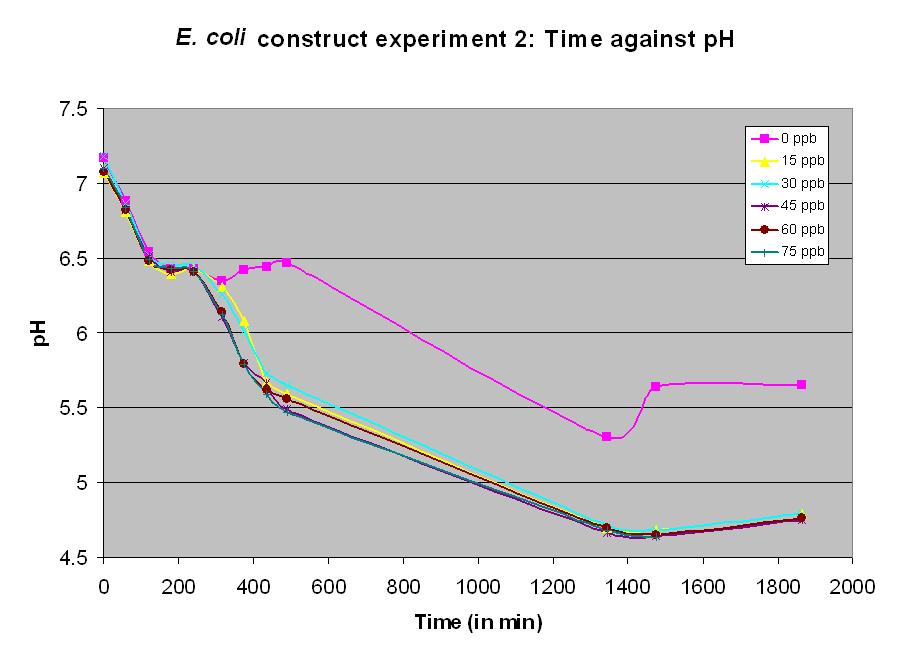
Experiment 11 also used BBa_J33203. Different concentrations of arsenic were added to the solution to test the sensitivity of the promoter. Lower concentrations were used than in experiment 10. The graph shows a measurable response at a concentration of 15 ppb.
Experiment 12 - Effect of arsenic concentration on rate of pH change of arsenic responsive E. coli
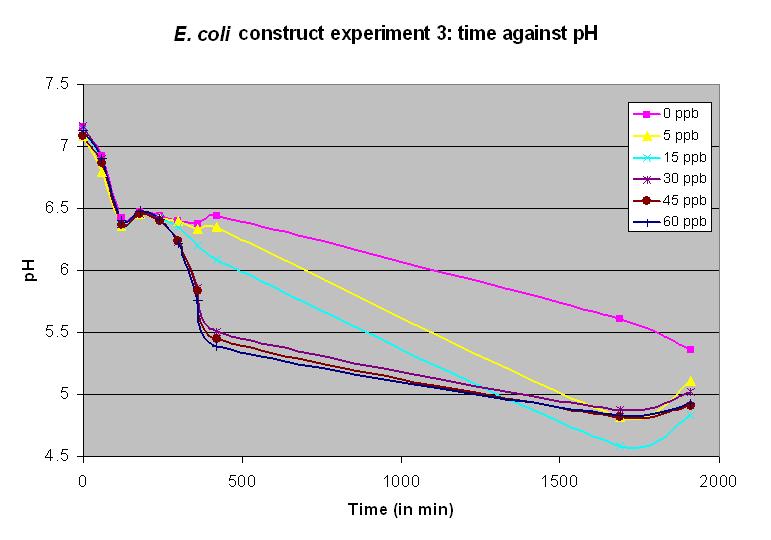
Experiment 12 was carried out using BBa_J33203 again. Different concentrations of arsenic were added to the solution to test the sensitivity of the promoter. Concentrations of 15 and 5 ppb produced a very slow but detectable response.
[http://2006.igem.org/University_of_Edinburgh_2006 Main page]
