Choosing constructs
From 2006.igem.org
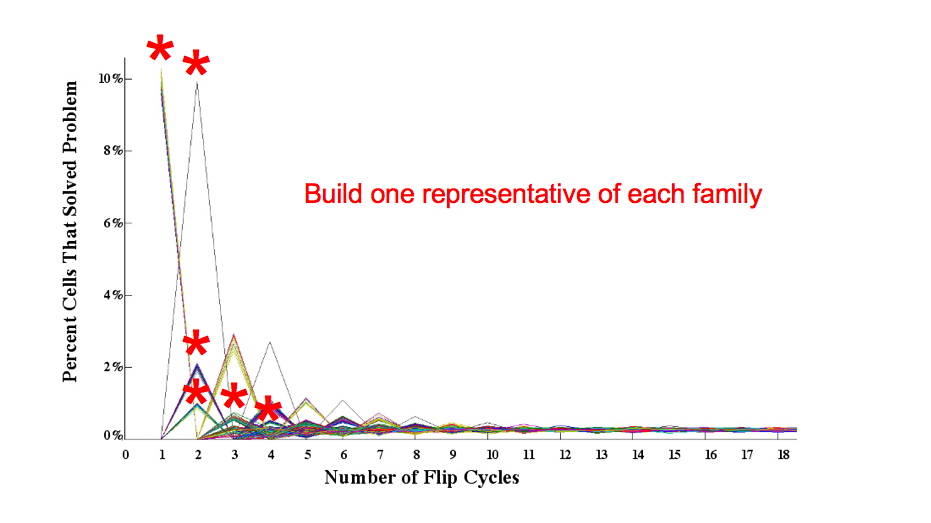
Each line in the graph represents simulation results for one of the 384 initial configurations of 4 pancakes. We simulated 20 random flips for each initial configuration, and graphed the percentage of plasmids that are sorted in the correct order and orientation after each number of flips. Asterisks indicate groups, or families, of initial configurations that behave the same. These families are determined by the number of different sequences of moves that can be made to sort the stack. The important insight from this modeling process is that only one member of each family needs to be built and tested.
In the lab, we will observe the percentage of cells that survive because they have solved the pancake problem. After a large number of flips, this percentage does not depend upon what the initial configuration was. This is illustrated in our graph by the levelling off of all initial configurations at a percentage of about 0.003. The power of building representatives from different families is that we will have several data points to calibrate against our lab results, allowing us to accurately estimate the flip rate.
