ETH2006 and
From 2006.igem.org
m (→modeling) |
(→Current implementation) |
||
| (29 intermediate revisions not shown) | |||
| Line 1: | Line 1: | ||
| + | →[[ETH Zurich 2006#System modeling|back to main page]] | ||
| + | |||
== AND gate == | == AND gate == | ||
| - | The AND gate's | + | The AND gate's PoPS output activity should be correlated to the PoPS input activity as shown in the picture: |
input A ^ | input A ^ | ||
| Line 12: | Line 14: | ||
output: High, Low, Dont care | output: High, Low, Dont care | ||
| - | === implementation alternatives === | + | === Implementation alternatives === |
| + | Different implementation alternatives for the AND gate were discussed and partially modeled. They can be found [[:Image:ETH_Modeling_Overview.pdf|here (early document versions)]], some [[ETH_Simulation_Scripts|simulation results]] are also available. | ||
| + | |||
| + | It was finally more of a strategic decision leading to the current implementation, though. | ||
| + | |||
| + | === Current implementation === | ||
Part to be used in the prototype system: [http://partsregistry.org/Part:BBa_J34100 BBa_J34100] | Part to be used in the prototype system: [http://partsregistry.org/Part:BBa_J34100 BBa_J34100] | ||
| - | [[Image:ETH and trna parts.png| | + | An AND gate produces an output only if both input signals are present. We want to implement such a “device” by using a suppressor tRNA. In our proposed model Signal 1 would lead to the transcription of the T7 RNA polymerase. However, an early stop codon was introduced into the coding sequence, leading to the expression of a truncated, non-functional protein. Signal 2, on the other hand, will lead to the expression of a suppressor tRNA. This tRNA recognizes the stop codon, preventing the end of translation and leading to incorporation of a glutamine into the nascent amino acid chain, so that translation can be completed. Consequently, a functional T7 RNA polymerase is present which will recognize its cognate promoter (T7 promoter) and therefore initiate expression of the downstream reporter gene (GFP). |
| + | |||
| + | [[Image:ETH and trna parts.png|500px|center]] | ||
| + | |||
| + | === Modeling === | ||
| + | ==== Some Formulas ==== | ||
| + | (''general explanatory notes from'' [[Template:ETH_Modeling_Formulas|this template]]) | ||
| + | {| style="background-color:#dddddd;border-spacing:10px;" | ||
| + | |- | ||
| + | | {{ETH_Modeling_Formulas}} | ||
| + | |} | ||
| + | |||
| + | ==== Current simulation results ==== | ||
| + | {| | ||
| + | |- | ||
| + | | align="center" | ''top view, ht<sub>Prot</sub>=2h'' || align="center" | ''3d surface plot, ht<sub>Prot</sub>=2h'' | ||
| + | |- | ||
| + | | [[image:ETH_Sim_And_2h_flat.png|300px|center|topside view of simulation results for AND gate, protein halflife period: 2h]] | ||
| + | | [[image:ETH_Sim_And_2h.png|350px|center|3d surface plot of simulation results for AND gate, protein halflife period: 2h]] | ||
| + | |- | ||
| + | | colspan="2" align="center" | ''simulation results for AND gate, different protein halflife periods<br/>top / bottom: output (z axis) is mRNA rate (∼PoPS) / reporter concentration''<br/>(x/y: ''inputs'', z: ''output'', ht<sub>Prot</sub>: ''protein halflife period'') | ||
| + | |} | ||
| + | |||
| + | For every plot, 25 (left) / 100 (right) ODE simulations were performed, simulating a time period of 12h. The simulations have been run with 2h halflife period for proteins. Complete parameter allocation can be found in the [[ETH_Simulation_Scripts|matlab scripts]] as well as the system of ordinary differential equations (ODEs). | ||
| + | |||
| + | '''About input rates''' (''general explanatory notes from'' [[Template:ETH_Sim_Input_Rate|this template]]) | ||
| + | {| style="background-color:#dddddd;" | ||
| + | |- | ||
| + | | {{ETH_Sim_Input_Rate}} | ||
| + | |} | ||
| - | |||
| - | |||
| - | + | The simulations show pretty much AND like behavior, but as mentioned, it is sensitive to the input strength. We want to find out about sensitivity more generally: | |
| - | === | + | ==== Sensitivity analysis ==== |
| + | '''Sensitivity matrices''' (''general explanatory notes from'' [[Template:ETH_Sensitivity_Matrices|this template]]) | ||
| + | {| style="background-color:#dddddd;border-spacing:10px;" | ||
| + | |- | ||
| + | | {{ETH_Sensitivity_Matrices}} | ||
| + | |} | ||
| - | |||
| - | === | + | The following bar3 plot shows sensitivity matrices for different input combinations: |
| + | {| | ||
| + | |- | ||
| + | | align="center" | ''AND: Sensitivity Analysis'' | ||
| + | |- | ||
| + | | <!-- [[image:ETH_Sens_AND_2h.jpg|600px|center|Normalized Sensitivity of the parameters for AND gate]] --> [[image:ETH_Sens_AND_2h.png|700px|center|Normalized Sensitivity of the parameters for AND gate]] | ||
| + | |- | ||
| + | | colspan="2" align="center" | ''Normalized Sensitivity of the parameters for AND gate'' | ||
| + | |} | ||
| + | The z axis shows the absolute normalized sensitivities, the other axes correspond to different input combinations (shorter axis) and the parameters. The left most series show inputs, not sensitivities (3x3 inputs, each <tt>[low, medium, high]</tt>). The unlabeled series is a placeholder for aesthetic purposes only. Detailed explanation of the parameter abbreviations can be found [[ETH_Sim_Constants|here]]. Parameters are postfixed with the state variable they belong to: | ||
| + | T7R : T7 RNA polymerase | ||
| + | T7Rd : truncated (deficient) T7 RNA polymerase | ||
| + | mT7R : mRNA for T7R | ||
| + | tRNA : tRNA suppressing early stop codon | ||
| + | Out : Reporter protein, here GFP | ||
| + | mOut : mRNA for Out | ||
| + | The figure shows | ||
| + | * Insensitivity regarding <tt>d-T7Rd/l-T7Rd</tt>, which verifies our model since degredation and translation of the deficient (truncated) mRNA polymerase has indeed no influence on the system output | ||
| + | * Various parameters are insensitive if at least one input is 0. This is clear since sythesized products from both input strands are needed for output stimulation. | ||
| + | * Some parameters of the reporter protein synthesis are sensitive even if both inputs are 0. This arises from the fact that there is always a constitutive transcription part even if the promoter is not activated by T7R. And in fact, <tt>p-Out</tt> controlling the constitutive portion has higher sensitivity if at least one input is 0. | ||
| + | * Relatively high sensitivity to changes in the input rate 2 leading to tRNA production. Since tRNA is very stable, producing more or less tRNA has strong and enduring impact. The other input is less sensitive since the produced T7R RNA polymerase has a much shorter half life period. Changing parameters affecting T7R production thus has weaker influence on the equilibrium concentration<br/>''Unclear: '' Why can't we see this in the input/output surface plot? | ||
| + | * ... | ||
| + | ==== More (old) simulation results ==== | ||
| + | [[ETH_Sim_Mod_AND_tRNA|simulation results]] / [[ETH_Sens_And|sensitivity analysis]] | ||
| + | === Parts === | ||
| + | [http://partsregistry.org/Part:BBa_J34100 BBa_J34100] | ||
| - | →[[ETH Zurich 2006# | + | →[[ETH Zurich 2006#System modeling|back to main page]] |
Latest revision as of 21:54, 1 November 2006
Contents |
AND gate
The AND gate's PoPS output activity should be correlated to the PoPS input activity as shown in the picture:
 input A ^
         | L  D  H
         | D  D  D
         | L  D  L
         +--------->
            input B

 output: High, Low, Dont care
Implementation alternatives
Different implementation alternatives for the AND gate were discussed and partially modeled. They can be found here (early document versions), some simulation results are also available.
It was finally more of a strategic decision leading to the current implementation, though.
Current implementation
Part to be used in the prototype system: [http://partsregistry.org/Part:BBa_J34100 BBa_J34100]
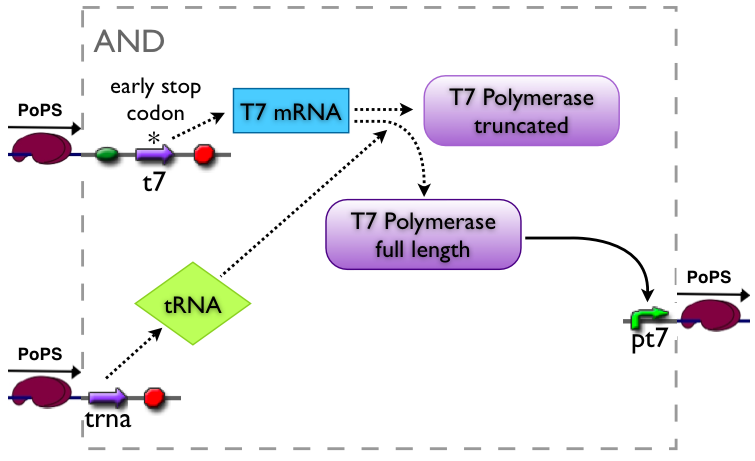
An AND gate produces an output only if both input signals are present. We want to implement such a “device” by using a suppressor tRNA. In our proposed model Signal 1 would lead to the transcription of the T7 RNA polymerase. However, an early stop codon was introduced into the coding sequence, leading to the expression of a truncated, non-functional protein. Signal 2, on the other hand, will lead to the expression of a suppressor tRNA. This tRNA recognizes the stop codon, preventing the end of translation and leading to incorporation of a glutamine into the nascent amino acid chain, so that translation can be completed. Consequently, a functional T7 RNA polymerase is present which will recognize its cognate promoter (T7 promoter) and therefore initiate expression of the downstream reporter gene (GFP).
Modeling
Some Formulas
(general explanatory notes from this template)
| To get our models into a form which can be simulated, we needed to transform the wiring diagrams into a set of ODEs (ordinary differential equations), which in our case will be non-linear.
For every concerned species X, we write d[X]/dt = production - consumption For enzymatic transformation of substrate S into product P (catalyzed by enzyme E), we write k+1 k2
S + E <==> E•S --> P + E
k−1
d[S]/dt = −k+1[S][E] + k−1[E•S] − dS[S]
d[E]/dt = −k+1[S][E] + k−1[E•S] + k2[E•S] − dE[E]
d[E•S]/dt = k+1[S][E] − k−1[E•S] − k2[E•S] − dES[E•S]
d[P]/dt = + k2[E•S] − dP[P]
[S] : substrate concentration
[E] : enzyme conc.
[E•S] : concentration of enzyme-substrate complex
[P] : product concentration
kinetic constants:
kk+1 : building enzyme-substrate complex (forward)
kk−1 : resolving enzyme-substrate complex (backward)
k2 : product formation
dXXX : degradation constants
For constitutive transcription, we have constant production rate and simply write d[M]/dt = ktr•u − dM[M] [M] : mRNA concentration ktr : kinetic constant (transcription) u : system input, e.g. transcription rate (≅PoPS) dM : degradation constant for mRNA A transcriptional regulatory module can be described by and ODE of the following form: 1
d[M]/dt = ktr ( a + −−−−−−−−−−−−−− ) − dM[M]
1 + (K/[S])α•n
[M] : mRNA concentration
ktr : kinetic constant (transcription)
a : constitutive portion, 0 ≤ a < 1
[S] : inducer (α=+1) / repressor (α=−1) concentration
K : hill constant
n : hill coefficient
α : α=+1 for induction, α=−1 for repression
dM : degradation constant for mRNA
Finally, translation is usually modeled like this: d[P]/dt = ktl[M] − dP[P] [P] : product (protein) concentration [M] : mRNA concentration ktl : kinetic constant (translation) dP : degradation constant for protein P References:
|
Current simulation results
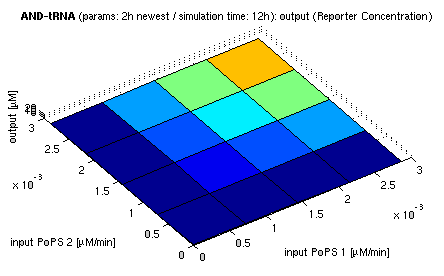
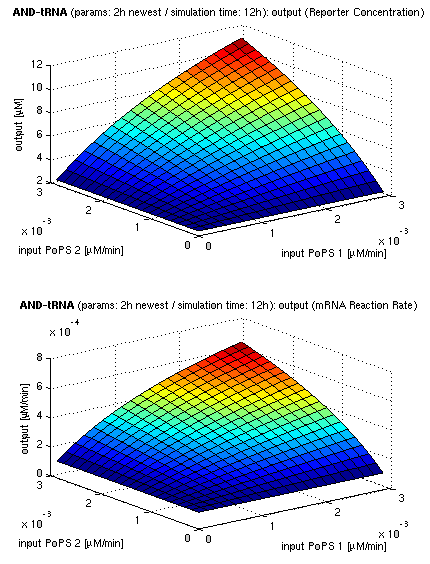
| top view, htProt=2h | 3d surface plot, htProt=2h |
| simulation results for AND gate, different protein halflife periods top / bottom: output (z axis) is mRNA rate (∼PoPS) / reporter concentration (x/y: inputs, z: output, htProt: protein halflife period) | |
For every plot, 25 (left) / 100 (right) ODE simulations were performed, simulating a time period of 12h. The simulations have been run with 2h halflife period for proteins. Complete parameter allocation can be found in the matlab scripts as well as the system of ordinary differential equations (ODEs).
About input rates (general explanatory notes from this template)
The input rates (PoPS) have been chosen in the range of mRNA transcription rate, which was estimated according to the following assumptions:
Amplifying/damping the input rates by small constant factors has influence on the qualitative outcome of the simulation.
We accounted for this by adding restriction enzyme sites to the DNA, so that we can cut out current RBS to replace it by another of different strength. |
The simulations show pretty much AND like behavior, but as mentioned, it is sensitive to the input strength. We want to find out about sensitivity more generally:
Sensitivity analysis
Sensitivity matrices (general explanatory notes from this template)
To analyze the sensitivity of the system for all concerned parameters, we compute the sensitivity matrix S:
S = (∂x/x) / (∂p/p) = (∂x/∂p) * (p/x)

S : sensitivity matrix, #x rows, #p columns
x : states (concentrations)
p : parameters
We use jacobian matrices of the system equations to compute the sensitivity matrix S. We therefore augment the set of differential equations by dS(t)/dt = Jx(t) S(t) + Jp(t) Jx(t) = ∂f(x,p,t)/∂x Jp(t) = ∂f(x,p,t)/∂p Since we are interested in the output sensitivities at steady state, we set dS(t)/dt = 0 and can solve for S: S = − Jx \ Jp \ : matrix left division |
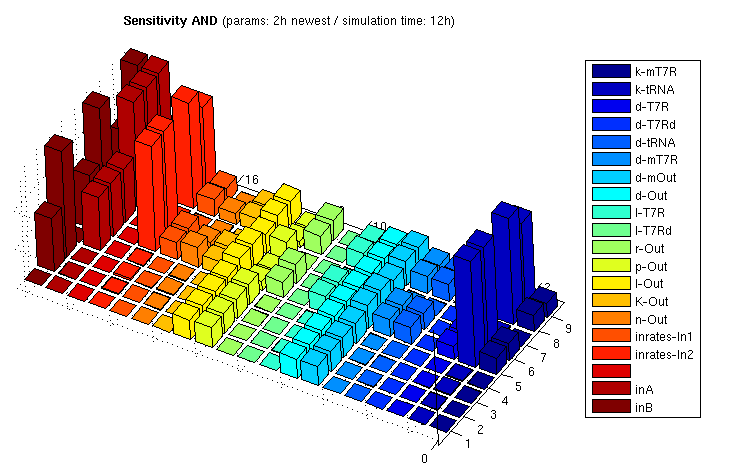
The following bar3 plot shows sensitivity matrices for different input combinations:
| AND: Sensitivity Analysis | |
| Normalized Sensitivity of the parameters for AND gate | |
The z axis shows the absolute normalized sensitivities, the other axes correspond to different input combinations (shorter axis) and the parameters. The left most series show inputs, not sensitivities (3x3 inputs, each [low, medium, high]). The unlabeled series is a placeholder for aesthetic purposes only. Detailed explanation of the parameter abbreviations can be found here. Parameters are postfixed with the state variable they belong to:
T7R  : T7 RNA polymerase
T7Rd : truncated (deficient) T7 RNA polymerase
mT7R : mRNA for T7R
tRNA : tRNA suppressing early stop codon
Out  : Reporter protein, here GFP
mOut : mRNA for Out
The figure shows
- Insensitivity regarding d-T7Rd/l-T7Rd, which verifies our model since degredation and translation of the deficient (truncated) mRNA polymerase has indeed no influence on the system output
- Various parameters are insensitive if at least one input is 0. This is clear since sythesized products from both input strands are needed for output stimulation.
- Some parameters of the reporter protein synthesis are sensitive even if both inputs are 0. This arises from the fact that there is always a constitutive transcription part even if the promoter is not activated by T7R. And in fact, p-Out controlling the constitutive portion has higher sensitivity if at least one input is 0.
- Relatively high sensitivity to changes in the input rate 2 leading to tRNA production. Since tRNA is very stable, producing more or less tRNA has strong and enduring impact. The other input is less sensitive since the produced T7R RNA polymerase has a much shorter half life period. Changing parameters affecting T7R production thus has weaker influence on the equilibrium concentration
Unclear: Why can't we see this in the input/output surface plot? - ...
More (old) simulation results
simulation results / sensitivity analysis
Parts
[http://partsregistry.org/Part:BBa_J34100 BBa_J34100]


