Biosensor Characterisation
From 2006.igem.org
(Difference between revisions)
| Line 30: | Line 30: | ||
[[Image:Expt_2_graph.JPG | Experiment 2 Graph | 800 px]] | [[Image:Expt_2_graph.JPG | Experiment 2 Graph | 800 px]] | ||
| + | |||
| + | Experiment 2 was carried out to find out what difference the volume of sterile water added to the solution makes to the rate of pH change. | ||
| + | |||
| + | {| border="1" | ||
| + | !width="100"| | ||
| + | !width="100"| | ||
| + | !width="100"| | ||
| + | !width="100"| | ||
| + | !width="100"| | ||
| + | !width="100"| | ||
| + | |- | ||
| + | | '''Experiment:''' || '''Control''' || '''2A''' || '''2B''' || '''2C''' | ||
| + | |- | ||
| + | | '''LB (ml):''' || 50 || 50 || 50 || 50 | ||
| + | |- | ||
| + | | '''Culture (ml):''' || 5 || 5 || 5 || 5 | ||
| + | |- | ||
| + | | '''Ampicillin (μl):''' || 10 || 10 || 10 || 10 | ||
| + | |- | ||
| + | | '''IPTG (μl):''' || 10 || 10 || 10 || 10 | ||
| + | |- | ||
| + | | '''Sterile water (ml):''' || 0 || 50 || 25 || 10 | ||
| + | |- | ||
| + | | '''Total volume (ml):''' || '''55.02''' || '''105.02''' || '''80.02''' || '''65.02''' | ||
| + | |} | ||
| + | |||
| + | |||
[[Image:Expt_3_graph.JPG | Experiment 3 Graph | 800 px]] | [[Image:Expt_3_graph.JPG | Experiment 3 Graph | 800 px]] | ||
Revision as of 10:17, 11 August 2006
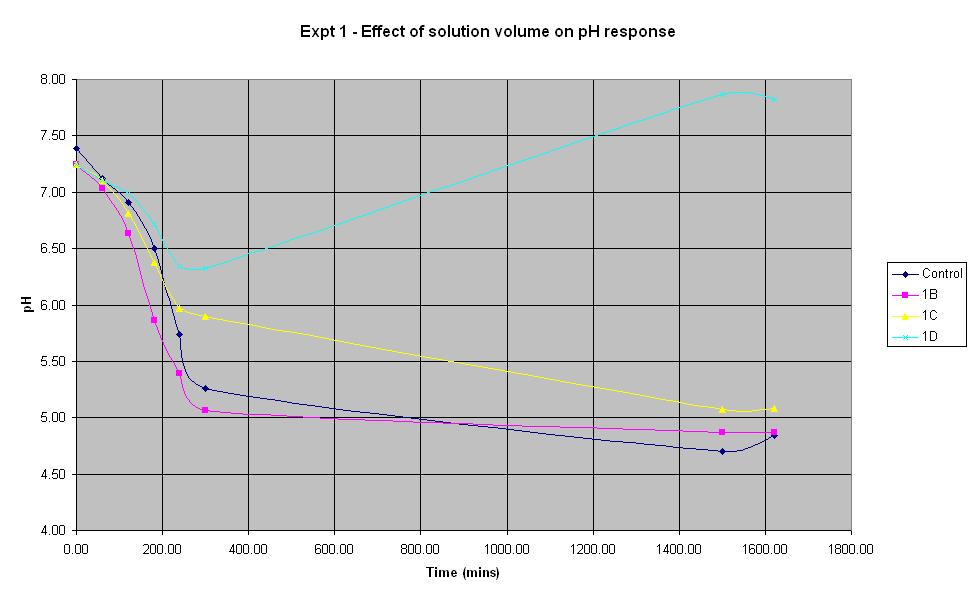
Experiment 1 was carried out to find out what difference the total solution volume makes to the rate of pH change.
| Experiment: | Control | 1B | 1C | 1D |
| LB (ml): | 50 | 25 | 10 | 5 |
| Culture (ml): | 5 | 3.125 | 1.25 | 0.625 |
| Ampicillin (μl): | 10 | 6.25 | 2.5 | 1.25 |
| IPTG (μl): | 10 | 6.25 | 2.5 | 1.25 |
| Total volume (ml): | 55.02 | 28.1375 | 11.255 | 5.627 |
The solution with total volume 28.1375 ml (1B) produced the fastest initial rate of pH decrease and reached approximately the same final pH as the control (pH 4.84).
The smallest solution volume changed pH at the slowest rate and after an initial decrease in pH, it then increased to 7.87 overnight.
Therefore, in the optimum order, 1B > Control > 1C > 1D
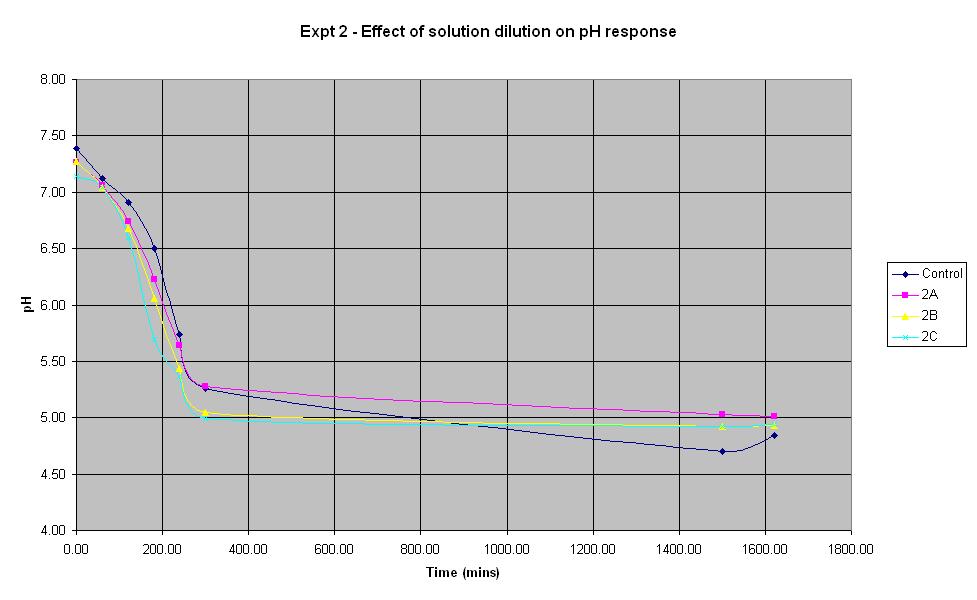
Experiment 2 was carried out to find out what difference the volume of sterile water added to the solution makes to the rate of pH change.
| Experiment: | Control | 2A | 2B | 2C | |
| LB (ml): | 50 | 50 | 50 | 50 | |
| Culture (ml): | 5 | 5 | 5 | 5 | |
| Ampicillin (μl): | 10 | 10 | 10 | 10 | |
| IPTG (μl): | 10 | 10 | 10 | 10 | |
| Sterile water (ml): | 0 | 50 | 25 | 10 | |
| Total volume (ml): | 55.02 | 105.02 | 80.02 | 65.02 |
[http://2006.igem.org/University_of_Edinburgh_2006 Main page]
