Brown:Tri-Stable toggle switch
From 2006.igem.org
A tri-stable toggle switch
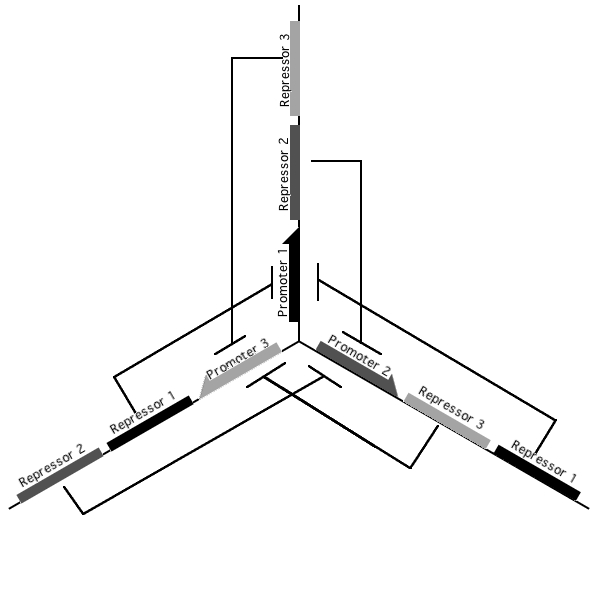
Pursuant to the the 1999 paper "Construction of a genetic toggle switch in Escherichia coli," by Timothy S. Gardner, Charles R. Cantor and James J. Collins, we wondered if the bi-stable toggle switch could be generalized to an n-stable switch. To that end, we conceived and began construction of the tri-stable toggle switch. The general idea is that when a selected promoter is activated, it represses the other two. As such each of the three states of our network are self-stabilizing.
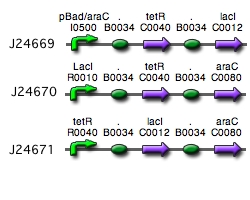
Our implementation uses the pLac, pTet, and pBad/AraC promoters and their respective inhibiting proteins. We chose these because of the relative ease with which each promoter is induced: by adding IPTG for the pLac-promoted region, tetracycline for the PTet-promoted region, and arabinose for the pBad/Ara genes. By characterizing each of the three pathways without following genes and terminators, we enable a tri-stable switching network of any three biobricks to be constructed with minimal cloning.
Modeling the tri-stable toggle switch
While the tri-stable switch is seemingly simple in design, just like any other system it is subject to potentially comprising factors such as promoter leakiness and other stochastic fluctuations. In an attempt to predict the behavior of the tri-stable switch, we created a deterministic model of the system taking into account these factors. The model structure is based on that described in "Prediction and measurement of an autoregulatory genetic module" by Farren Isaacs, et al. This paper features an excellent supplement that takes you hand-in-hand through the derivation of model equations. I will attempt to emulate this derivation with our model below. It is important to note that while we have some preliminary results, our model is very much a work in progress. In order to model the system accurately, many of the fundamental constants governing the model will need to be determined experimentally. For now we have used some constants from the literature and estimated some based on similar the values of similar constants also from the literature.
Derivation of the Model Equations
The chemical reactions describing the tri-stable switch can be divided into the two catagories of fast and slow reactions. Fast reactions such as dimer formation and promoter-binding occur in the scale of seconds and are therefore modeled to be in equilibrium. Conversely, slow reactions including the likes of transcription, translation, and protein degradation occur on the scale of minutes and are thus modeled to be evolving with time.
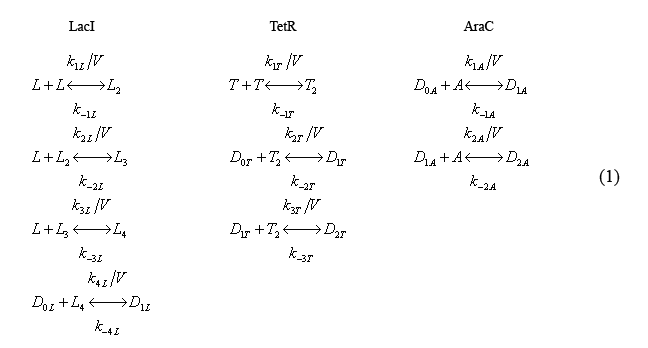
Fast reversible reaction equations
The following equations (1) describe the fast reactions. The characters L,T,A denote molecules of LacI, TetR, and, AraC, respectively while the subscripts denote whether the molecule is a monomer (blank), dimer(2), tri-mer(3), etc. The k's denote reaction rates.
Note that the equations include volume explicitly. Cell volume is modeled in this way as it is a slowly evolving function of time.
Slow irreversible reaction equations
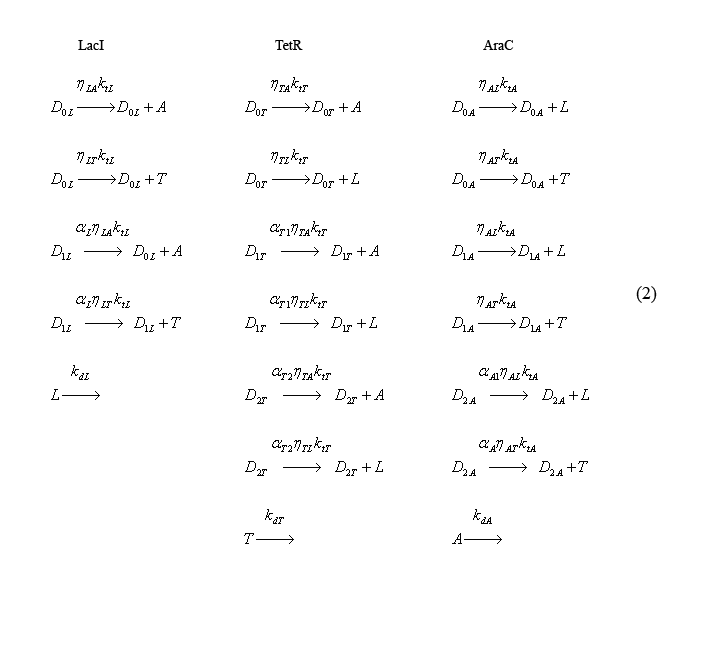
The following equations (2) describe the slow irreversible reactions of transcription and translation (both taken into account with the reaction rate kti) and protein degradation (reaction constant kdi). The coefficients eta-ij take into account the relative translation rates of proteins from the same transcripts. For eta-ij, "i" represents the promoter responsible for producing the molecule and "j" represents the molecule being translated [ex: eta-LA corresponds to the relative rate of AraC production from the trascript produced by the LacI promoter]. To establish a convention, eta's are relative to the translation rate of the first gene on a particular transcript. Thus eta for the first gene on the mRNA transcript = 1. The alpha-i coefficients represent relative transcription rates. In this case, "i" denotes the promoter from which the mRNA is transcribed.
Equations governing cell volume
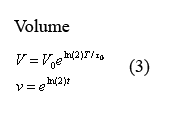
The following two equations (3) describing cellular growth and division are taken directly from the aforementioned paper by Isaacs et al. The first equation describes the volume increase from the time immediately following cell division to the time immediately before it. In this equation, V0 denotes the volume of the cell at the beginning of growth and T0 denotes the time of cell division. In our model at times T=q*t0 in which q is an integer, we have volume V and protein concentration n halve - thus modeling volume division and the resulting protein redistribution. The second equation describes the dimensionless equation in which t is measured in terms of fcell-division time and the cell volume changes between 1 and 2.
Equations for the total number of molecules
The following equations (4) describe the total number of inhibitor protein molecules zi. d#i represents the number, "#", of molecules bound to the "i" promoter. (ex: all of the LacI tetramers bound to pLacI promoters are accounted for by the 4d1L term.)

Equations describing the temporal evolution of the total number inhibitor molecules
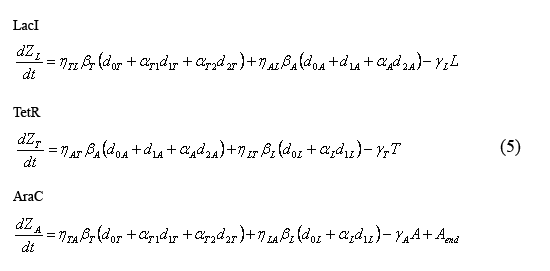
The following equations (5) describe the temporal evolution of the total number of inhibitor molecules. Beta-i = the cell division time multiplied by the combined transcription and tranlation rates from a given promoter "i" (t0*kti), thus representing the total number of protein molecules maximally produced by a given promoter. Similarly, Gamma-i = the cell division time multipled by the degradation rate of protein i (t0*kdi), thus representing the total number of protein i destabilized over one cell division time. The eta and alpha terms are described in the section above describing the equations for the slow reactions. Note that the equation describing the temporal evolution of AraC includes the term "Aend." This term represents the endogenous expression of AraC in dH5alpha's. Our preliminary work suggests that this endogenous AraC has very little effect on our pBad promoter.
Fast reaction equilibrium equations
Compared to the slowly evolving reactions(2) described by the above equations (5), the fast reactions (1) can be considered to be in equilibrium. Thus the following equilibrium relations (6) hold.

Equations modeling the presence of the inducers
The following equations (7) model the effect of the chemical inducers on the system. The model regards the proteins bound to the inducers as having increased dissociation rates (ki-#) as specified below. The reation rate with the apostrophe denotes the original reaction rate in the absence of inducer inclusion. In these equations "I" denotes IPTG, "a" denotes arabinose, and "Tc" denotes tetracycline (or analogue aTc). The concept for and the form of these equations are based on equations described in the supplementary Information for "A bottom-up approach to gene regulation" by Guido et al. Much like the aforementioned paper by Isaacs et al., 'Bottom-up' has an extensive and brilliantly articulate derviation supplement.
Equations relating plasmid copy number to operator sites
The following equations (8) relate the plasmid copy number, "m", to the number of promoters with bound and unbound operators. As each plasmid contains 1 of each promoter, m is constant for all three promoter types.
Simplified fast reaction equilibrium equations
The equilibrium equations governing the fast reactions (6) can be simplified by defining dimensionless equilibrium constants in the form of cij=kij/(k(-ij)*V0*A) in which A is Avogadro's number. The cL's are further simplified by defining the constant cL=c1L*c2L*c3L*c4L. Additionally by plugging in successive terms we were able to write the operator equations in terms of d0L.
Equations for the number of unbound operators
Combining equations (8) and the above simplified equilibrium equations(9), we are able to solve for the number of unbound operators d0i.
Equations for the number of bound operators
By plugging the d0i's (10) back into the equations for bound operators (9), we can solve for these equations in terms of monomer concentrations.
Equation manipulations to determine change in protein monomers per time
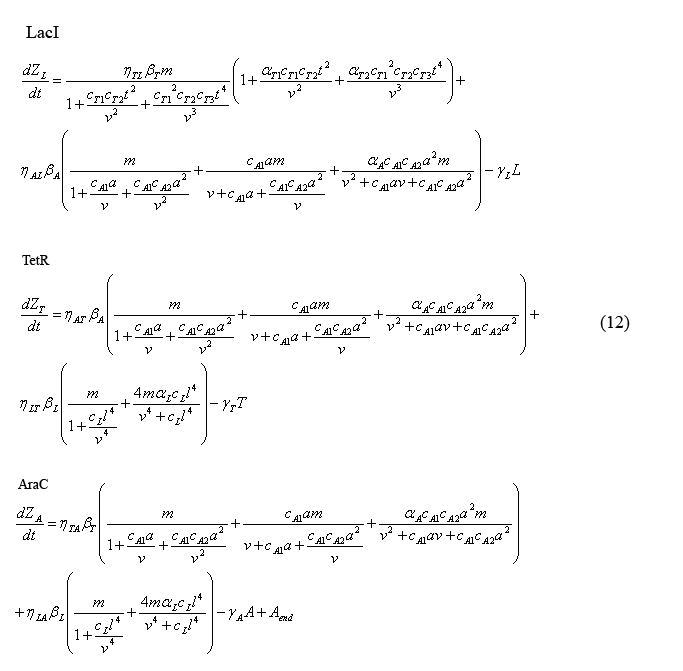
Next we can rewrite the equations describing the temporal evolution of the total number inhibitor molecules (5) in terms of equations (10) and (11). This yields the somewhat complex equations (12) which are solely in terms of monomer protein concentration.
Equations for the change in protein monomers per time
By applying the simple mathematical manipulation (13) to equations (12) and the X derivative of equations (9) ((9) can be written in terms of X by plugging in equations (10) and (11)) we can solve for the following equations for the evolution of protein monomers as a function of time (14). I will spare you the dZi/dXi derivative equations of equation (9).
Equations describing stochastic variation
Equations for the evolution of fluorescent reporters
Table of preliminary model constants
General Parameters
| Parameter | Value | Meaning |
|---|---|---|
| m | 20 Copies | Plasmid Copy Number |
Inhibitor Protein Parameters
| Parameter | Value | Meaning |
|---|---|---|
| etaLT | 1 | Relative rate of TetR translation from pLacI promoter |
| etaLA | 1 | Relative rate of AraC translation from pLacI promoter |
| etaAL | 1 | Relative rate of LacI translation from pBAD promoter |
| etaTL | 1 | Relative rate of LacI translation from pTetR promoter |
| etaAL | 1 | Relative rate of TetR translation from pBaD promoter |
| etaTA | 1 | Relative rate of AraC translation from pTetR promoter |
Preliminary modeling results
Coming Soon...
Link to MATLAB code for tri-stable model Media:tristable1.m
--Jlohmuel 03:59, 28 October 2006 (EDT)

