Biosensor Characterisation
From 2006.igem.org
(Difference between revisions)
| Line 1: | Line 1: | ||
[[Image:Expt_1_Graph.JPG | Experiment 1 Graph | 800 px]] | [[Image:Expt_1_Graph.JPG | Experiment 1 Graph | 800 px]] | ||
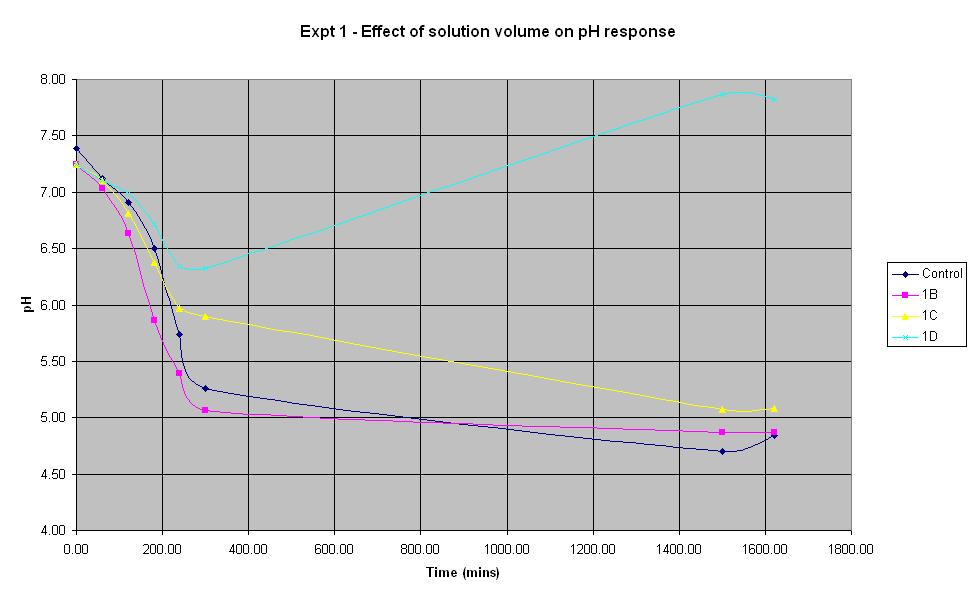
| - | + | Experiment 1 was carried out to find out what difference the total solution volume makes to the rate of pH change. | |
| - | + | ||
| - | + | ||
| - | + | ||
| + | {| border="1" | ||
| + | !width="100"| | ||
| + | !width="100"| | ||
| + | !width="100"| | ||
| + | !width="100"| | ||
| + | !width="100"| | ||
| + | |- | ||
| + | | '''Experiment:''' || '''Control''' || '''1B''' || '''1C''' || '''1D''' | ||
| + | |- | ||
| + | | '''LB (ml):''' || 50 || 25 || 10 || 5 | ||
| + | |- | ||
| + | | '''Culture (ml):''' || 5 || 3.125 || 1.25 || 0.625 | ||
| + | |- | ||
| + | | '''Ampicillin (μl):''' || 10 || 6.25 || 2.5 || 1.25 | ||
| + | |- | ||
| + | | '''IPTG (μl):''' || 10 || 6.25 || 2.5 || 1.25 | ||
| + | |- | ||
| + | | '''Total volume (ml):''' || '''55.02''' || '''28.1375''' || '''11.255''' || '''5.627''' | ||
| + | |} | ||
[[Image:Expt_2_graph.JPG | Experiment 2 Graph | 800 px]] | [[Image:Expt_2_graph.JPG | Experiment 2 Graph | 800 px]] | ||
Revision as of 10:05, 11 August 2006
Experiment 1 was carried out to find out what difference the total solution volume makes to the rate of pH change.
| Experiment: | Control | 1B | 1C | 1D |
| LB (ml): | 50 | 25 | 10 | 5 |
| Culture (ml): | 5 | 3.125 | 1.25 | 0.625 |
| Ampicillin (μl): | 10 | 6.25 | 2.5 | 1.25 |
| IPTG (μl): | 10 | 6.25 | 2.5 | 1.25 |
| Total volume (ml): | 55.02 | 28.1375 | 11.255 | 5.627 |
